Mass spectrometry & spectroscopy
Basics of ATR Spectroscopy
Jun 01 2021
Introduction
ATR has become the dominant method for collecting an FTIR spectrum of solid materials. It requires little or no sample preparation and is effective at both qualitative and quantitative measurements.
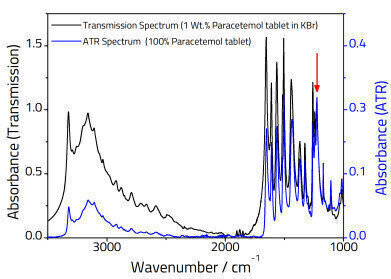
Compared to the older method of preparing a KBr pellet for transmission spectroscopy, important differences emerge. An ATR spectrum is not directly comparable to a transmission spectrum, although software algorithms are available in most commercial spectrometers capable of converting an ATR spectrum into a transmission-like spectrum should the analyst wish to compare them.
This note outlines the basics of the ATR method, providing the analyst with the information they require to gain the most out of the technique.
How does ATR work?
The basic theory of ATR is straightforward. An IR beam is reflected off the surface of a crystal from the underside and interacts with a sample of lower refractive index placed onto the surface of the crystal. Recording the intensity of the light reflected before and after placing a sample on the crystal surface produces the characteristic infrared spectrum of your sample. The basic setup is shown in Figure 1.
In order to ensure that the beam of light is reflected rather than transmitted through the surface of the ATR crystal the angle of incidence must be above the critical angle. This varies depending on the crystal material chosen. The Specac Quest™ has a fixed angle of incidence of 45° which is above the critical angle for all ATR crystals.
Penetration Depth
It is important to state that the IR beam does not exit the surface of the crystal at the crystal/sample interface. Instead, the electric component of the light propagates into the rarer sample medium. This is known as called an evanescent wave, and its strength decreases exponentially as it propagates into the sample. As a result, the penetration depth of ATR spectroscopy is very short. The exact depth depends on several factors including the sample type and the wavelength of the light.
Higher frequencies have a smaller penetration depth, so one difference between a transmission and ATR spectrum is that the relative peak intensities at higher wavenumbers are reduced relative to the lower frequency end of the spectrum as illustrated in Figure 2.
Crystal Choice
A range of materials are available to choose from for your ATR crystal. The best one to choose depends on your application. ZnSe is suitable for day-to-day applications, however care should be taken to avoid harder samples and point loads as these can cause the crystal to shatter. It is also critical to ensure the crystal is not exposed to acidic or strongly basic samples as these can cause the formation of toxic fumes. Ge is suitable for materials with a high refractive index and for surface studies owing to its smaller penetration depth.
To learn more make sure to read through our Technical Note – TN21-01.
Digital Edition
Lab Asia Dec 2025
December 2025
Chromatography Articles- Cutting-edge sample preparation tools help laboratories to stay ahead of the curveMass Spectrometry & Spectroscopy Articles- Unlocking the complexity of metabolomics: Pushi...
View all digital editions
Events
Jan 21 2026 Tokyo, Japan
Jan 28 2026 Tokyo, Japan
Jan 29 2026 New Delhi, India
Feb 07 2026 Boston, MA, USA
Asia Pharma Expo/Asia Lab Expo
Feb 12 2026 Dhaka, Bangladesh
.jpg)
