Mass spectrometry & spectroscopy
Fluorine Analysis Using Molecular Absorption Spectroscopy
Sep 08 2014
Author: Dr. Tobias Frömel, Sascha Münster-Müller, Professor Dr. Thomas P. Knepper on behalf of Fresenius polytechnic
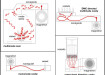
Fluorinated organic substances gained in importance in recent decades, because substitution with fluorine holds many beneficial characteristics for the application. Not only fluorinated polymers, such as polytetrafluorethylene (PTFE, Teflon®) are encountered at many places in everyday life, but many low-molecular organic substances also contain one or several fluorine atoms, for example, some pharmacologically active substances, such as fluoxetine (see Figure 1), as well as pesticides, such as tolylfluanide (Figure 1). In the past decade perfluoroalkyl and polyfluoroalkyl (PFASs, formerly also PFC = perfluorinated and polyfluorinated compounds or PFT=’perfluorinated tensides’) gained great attention. This class of substances of which perfluorooctanoic acid (PFOA) and perfluorooctane sulphonic acid (PFOS) are the most researched substances, have many negative properties for people and the environment [1].
Figure 1. Structural formulas of various fluorinated organic compounds
Since the common methods of today for the quantification of known substances utilise methods with a defined analyte spectrum, mainly the high performance liquid chromatography coupled with the tandem mass spectrometry (HPLC-MS/MS), unknown compounds of this substance class are not detected by the method. However, some studies lead to the result that the content of unknown PFASs in environmental samples exceeds that of specific individual substances [2].
For this reason a cumulative parameter for organic fluorinated substances, similar to the AOX value, would be desirable. This could play a role as routine method, e.g. in galvanic wastewater, drinking water, after enrichment of the analytes and separation of matrix substances, but also in food analysis. However, common digestion methods fail for PFASs due to the very strong C-F bonding which withstands both high thermal and chemical loads [1; 3; 4].
Molecular Absorption Spectroscopy of Gallium Fluoride
Here, the molecular absorption spectroscopy (MAS) forms an elegant option for detecting organically bound fluorine. In several examinations fluorine was analysed using this method [5; 6]. This is implemented by the MAS of GaF, which is formed by adding Ga(III)-nitrate under moderate temperatures. The resulting GaF can be measured with an atomic absorption spectrometer with continuous light source and high resolution optics at a wavelength of 211.2480 mm (Figure 2). The sample is put through a temperature/time program in a graphite tube furnace causing the formation of GaF which is then detected by spectroscopy. To this end a contrAA® 700 was used with autosampler AS-GF (Analytik Jena, Jena).
Figure 2. contrAA® 700 by Analytik Jena
Sensitivity of Various Analytes
After optimising the method parameters (solvent, pyrolysis temperature and molecule generation temperature) calibration graphs of various fluorinated organic compounds were recorded to examine the effect of different perfluoroalkyl chain lengths and functional groups on sensitivity (calibration graph gradient). A method for the calculation of the total of organically bound fluorine would ideally have the same sensitivity to all fluorinated organic substances.
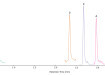
As shown in Figure 3, the sensitivity to the compounds 2-fluorobenzoic acid (2-FBA, as representative of phenyl-bound fluorine), PFOS, PFOA, perfluoroheptanoic acid (PFHpA) is within an similar range. The sensitivity to sodium fluoride is in the medium range of the fluorinated organic compounds.
To compensate for the differences in sensitivity as much as possible, a mixed standard was used for calibration (mixed calibration standard, MCS). The gradient of the calibration graph is within a range, so that the deviation of the calibration graph gradients of the individual substances is < 30%. This MCS contains equimolar ratios (related to the fluorine content) of PFOA, PFOS, PFHpA, 2-FBA and NaF.
Since the use of PTFE components in the autosampler of the contrAA results in a significant blind value, the MFA (perfluoroalkoxy polymer) autosampler hose was replaced with a polyamide hose. This has a lesser service life when using organic solvents but significantly reduces the blind value.
Figure 3. Calibration graphs for various fluorinated organic compounds and sodium fluoride
After this modification verification limits in the range of 0.5 µg/L and detection limits in the range of 1.5 µg/L were achieved with the calibration of the mixed standard. By enriching the substances by way of solid phase extraction (SPE), verification limits down to the lower ng/L range are possible. This permits realistic concentration ranges in drinking water or food analysis.
Compounds, such as 8:2-fluorotelomer alcohol (8:2-FTOH) cannot yet be detected with the current method due to their volatility. The corresponding calibration graph has a much lower gradient than for carbonic and sulphonic acid. Here, a derivatisation to carbonic acid derivatives could provide a remedy [7].
Problematic is the simultaneous detection of inorganic fluoride in the mg/L range and fluorinated organic compounds of low concentration in the ng/L range. To separate the fluoride the selective solid phase extraction is recommended.
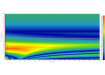
Figure 4. Calibration graphs in ultrapure water and galvanic process water of various dilution stages
Application Example: Galvanic Process Water
To demonstrate the robustness of the measuring method an example for inorganic fluoride detection should be explained. Even in samples with extreme matrix loads, e.g. in galvanic process water having a highly oxidising environment with very low ph value inorganic fluoride can still be safely quantified in the mg/L range after dilution (see Figure 4).
Summary
The analysis of inorganic and organic fluoride species using MAS is a unique and simple method for the detection of total fluorine in organic and aqueous samples. Existing methods are supplemented with the option to also quantify fluorinated organic compounds that are hard to access for their fluorine content. Due to the simplicity and high sample throughput of the method it has the potential of versatile utilisation in routine analyses.
Digital Edition
Lab Asia Dec 2025
December 2025
Chromatography Articles- Cutting-edge sample preparation tools help laboratories to stay ahead of the curveMass Spectrometry & Spectroscopy Articles- Unlocking the complexity of metabolomics: Pushi...
View all digital editions


Events
Jan 21 2026 Tokyo, Japan
Jan 28 2026 Tokyo, Japan
Jan 29 2026 New Delhi, India
Feb 07 2026 Boston, MA, USA
Asia Pharma Expo/Asia Lab Expo
Feb 12 2026 Dhaka, Bangladesh


