Analytical instrumentation
Enhancing property predictions of gasoline using MIR + NIR FTIR spectroscopy – with eralytics’ new MIR+NIR PLS model
Aug 28 2025
Author:
Dr. Niklas Christensson
on behalf of Eralytics GmbHFree to read
Articles are free to download. Unlock the article to be shown more content, graphs and images.
Introduction
As blend-to-spec products, fuels can vary greatly in composition depending on crude oil source, refining techniques, regulatory requirements as well as the use of blending components like oxygenates. Furthermore, with the shift of refining capacity, fuel exports have increased and today, fuel is truly a global commodity. As a consequence, the demand for accurate screening of fuels on-site has increased.
Infrared spectroscopy is a popular tool to obtain information about the molecular composition of an unknown fuel. Using the IR spectrum of the fingerprint region between 600-1200 cm-1, it is possible to determine the composition and concentration of aromatics, oxygenates and olefines in gasoline samples. While the information about the gasoline composition is important for the regulatory compliance (aromatic content, oxygenate content etc.), the wealth of information in the IR spectrum allows for the use of chemometric models to predict properties of the fuel. The most prominent examples of such properties are octane numbers (RON & MON) and distillation points.
To predict a property, a database of fuels with reference values and the corresponding IR spectra have to be collected. After building the model, the IR spectrum of an unknown sample can be used together with the model to predict its properties. Hence, after building a model, the application of expensive and time-consuming reference methods can be avoided. This makes the use of chemometric models particularly attractive for screening and mobile lab applications where a quick measurement can provide a very detailed picture of the composition and the properties of the fuel.
A typical gasoline displays a very rich spectrum in the mid-infrared (MIR) spectral range. Here the concentration and composition of aromatics and oxygenates and concentration of olefins can be accurately determined. These parameters also affect properties such as RON and MON and allow these properties to be predicted using chemometric models. However, the MIR spectrum provides limited information of the composition of the fuel’s backbone, i.e. the alkanes. This information is mainly contained in the CH stretch vibrations around 3000 cm-1 and to some extent in the CH2 and CH3 bending vibrations around 1300-1500 cm-1. However, as the absorption of the stretch vibration is very strong, they saturate even for very short path lengths of 20 µm in IR spectroscopy. Hence, the stretch vibration, and thus the major source of information about the alkanes, cannot be used for chemometric analysis.
The lack of information on the alkanes is problematic as they typically make up as much as 2/3 of the fuel. The alkanes strongly affect the property which is to be predicted (i.e. RON) but as they are not clearly visible in MIR, they are to a large extent implicitly hidden in the models. For this reason, it is common to develop different MIR models for different geographical regions, fuel types or frequently update the models as new fuels are encountered.
MIR+NIR FTIR spectroscopy for property prediction
A path to improve the accuracy and applicable range of the chemometric models of fuels would thus require additional information about the fuels backbone. A way to increase the information about the backbone of fuels is to extend the spectral range to the near infrared (NIR) range where the so-called combination bands show absorption. In the range of 4000-4500 cm-1 the combination of the CH2/CH3 bending and the CH stretch vibration give rise to absorption. By exploiting this spectral range, the molecular sensitivity of the CH stretch vibration to the alkane distribution can be obtained indirectly and can be combined with the information on the aromatics, oxygenates and olefines from MIR spectral range.
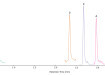
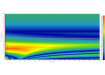
To illustrate the additional information offered by the extended spectral range, figure 1 shows two fuels with a RON of 95.5. The MIR spectral range shows that fuel 1 has higher olefine content, fuel 2 has somewhat higher aromatic content and both fuels have been blended with about 10% MTBE. Additional ASTM D6839 (i.e. PONA) analysis showed that fuel 1 had 8 % C5 paraffines, whereas fuel 2 had 21 %. This difference clearly affects the octane number of the fuel but cannot be detected in the MIR spectral range. In the NIR spectral range, shown in figure 2, the significant difference in C5 distribution is reflected in the spectral differences around 4050 cm-1.
The extension of the spectral range to cover the NIR spectral range thus seem to offer advantages in the information on the fuels backbone, which could improve stability and accuracy of chemometric models.
However, the combination bands in NIR spectral range are significantly weaker than the fundamental vibrations in the MIR spectral range. To obtain a spectrum where the fundamental bands and the combination bands are both measured with similar accuracy, eraspec employs measurement cells with different pathlengths. The fuel spectrum is measured in the MIR region (600-1500 cm-1) through a 20 µm transmission cell and in the NIR region (4000-4500 cm-1) through a 500 µm cell. The spectra are then normalized to the individual cell pathlength and background corrected. To harness the entire spectral information, a partial least squares (PLS) model was applied to the combined spectra.
Sample set
To develop a model for the MIR+NIR PLS, 932 gasolines from 88 countries were collected and analyzed with ASTM D2699 (RON), ASTM D2700 (MON), D86 (Distillation) as well as ASTM D6839 (PONA). The spectra of the fuels were measured with eralytics’ eraspec with its MIR+NIR module. For each parameter, a PLS model based on the combined spectral information in MIR and NIR was developed.
MIR+NIR model properties
Figure 3 shows the calibration model for RON. The number of samples, the standard error of calibration (SEC) and adjusted R2 coefficient is shown in table 1. The spectral data from the MIR spectral range was used to develop a standard Multi Linear Regression (MLR) model using the respective peaks used in eraspec’s gasoline module. The respective SEC and R2 for RON for the MIR model is shown in table 1.
The results for the predicted properties are summarized in table 1.
Table 1. PLS model based on the combined MIR+NIR spectral range. In addition, the MLR model based on the MIR spectrum only for RON is shown.
The spectral data from the MIR range was also used to generate a PLS model. This model had SEC somewhere between the MIR and the MIR+NIR models. However, the PLS model using only the MIR range proved to be very difficult to transfer to different units due to the strong dependence on the CH2 and CH3 bend region. To obtain a transferable model (i.e. reproducible results over many instruments for the same sample), the number of PLS components had to be reduced to such an extent that the PLS model produced a SECs similar to the MLR model. Hence, the PLS model based on only the MIR spectral range was not pursued further.
Model validation
Full range spectral models like PLS are prone to overfitting and poor reproducibility when transferred to different instruments. It is thus important to validate the model using external validation samples to confirm that the model can be transferred to different instruments without losing its precision. To validate the robustness of the model, validations sets were collected, and the samples were measured on units not used to develop the model.
To validate the model, external validation sets were collected, and the samples were analyzed with ASTM D2699. The first validation set comprised 563 gasolines collected at refineries and gas stations in all regions of mainland China. The second validation set comprised 327 gasolines collected from 8 refineries in India. All validation samples were measured locally and on instruments not involved in the development of the PLS model.
To gauge the models performance on the external validation sets, the standard error of prediction (SEP) and average error between predicted value and actual value (Δ) was used. The summary of the external validation sets are shown in table 2.
Table 2. Standard error of Prediction (SEP) and the average error (Δ) for MIR+NIR and MIR models for the two external validation set.
Both external validation scenarios show that the MIR+NIR PLS model produces good results on unknown samples, i.e. the SEP is close to the SEC. The close to zero average difference (Δ) of predicted and actual RON for both sample sets shows that the model can be transferred to different instruments and produce consistent results. Furthermore, it has been shown that for both scenarios the MIR+NIR PLS model outperforms the MIR MLR model by a factor of 2.
Expanding the model
The second validation set showed a somewhat larger deviation between SEC of the model (0.52) and SEP (0.78). This is mostly related to the high-octane samples which were not well represented by the model. A number of these samples showed elevated concentrations of mesitylene far outside those found in the calibration model. These samples were flagged based on the elevated Mahalanobis distance. To improve the accuracy of the model, such samples should be added to the model to expand it to improve future analysis of such samples.
The 327 samples from the Indian validation set was used to train (i.e. expand) the model. Then the performance of the validation set was recalculated.
Table 2. Standard error of Prediction (SEP) and the average error (Δ) for MIR+NIR and MIR models for the 2nd external validation set before and after training with the local samples.
The updated model provides better results when applied to the second validation set. The MIR+NIR PLS model showed SEP of 0.48 RON, which is actually better than the SEC of the original calibration model.
This illustrates that even a very large factory model can be improved by adding local samples and expanding the model. It is possible to do such model updates directly on the eraspec fuel analyzer without the need for a PC or other proprietary software.
Expanding the MIR MLR model also leads to an improvement. However, the SEP is 0.91 RON and still a factor 2 worse than that of the MIR+NIR PLS model. Note that the untrained MIR+NIR PLS model outperforms the trained MIR MLR model (SEP = 0.78 vs SEC = 0.91). Even after training the MIR model with over 300 local samples, it proved to be inferior to the “factory” MIR+NIR PLS model.
Conclusion:
A MIR+NIR PLS model has been developed for eralytics eraspec fuel analyzer to predict properties of gasolines based on a global calibration set containing more than 930 fuel samples. The SEC of the MIR+NIR PLS model was found to be about a factor of 2 better than a model employing only the MIR spectral range.
External validation with instruments not used to develop the model showed the robustness of the model and validated the employed calibration transfer routines. In two different validation scenarios, the improvement in accuracy using the additional information from the NIR part of the spectrum was found to be a factor 2, i.e. the advantage seen in SEC is maintained for the external validation.
The successful application of the global MIR+NIR PLS model to the two external validation set demonstrates that a stable global model can be successfully developed. As this model covers a very wide scope of fuels, it is less prone to model updates. However, if fuels which are outside the calibration model are encountered, the PLS model can be re-trained directly on the instrument without any external software.
Free to read
Articles are free to download. Please login to read this article or create an account.
Digital Edition
Lab Asia Dec 2025
December 2025
Chromatography Articles- Cutting-edge sample preparation tools help laboratories to stay ahead of the curveMass Spectrometry & Spectroscopy Articles- Unlocking the complexity of metabolomics: Pushi...
View all digital editions


Events
Jan 21 2026 Tokyo, Japan
Jan 28 2026 Tokyo, Japan
Jan 29 2026 New Delhi, India
Feb 07 2026 Boston, MA, USA
Asia Pharma Expo/Asia Lab Expo
Feb 12 2026 Dhaka, Bangladesh


