-
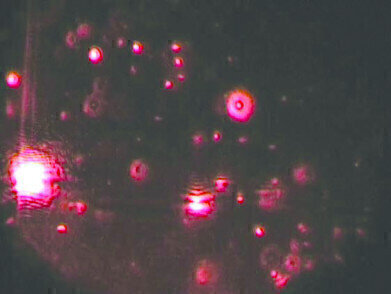 Figure 1
 -
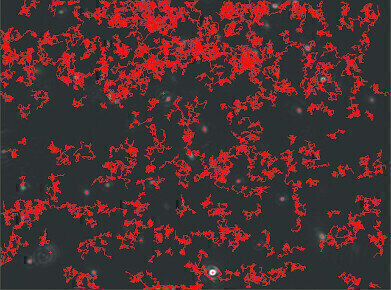 Figure 2
 -
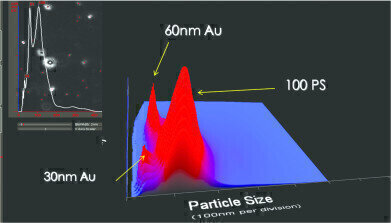 Figure 3
Microscopy & microtechniques
Nanoparticle Tracking Analysis - See what you’ve been missing
Jul 03 2013
NanoSight’s “Nanoparticle Tracking Analysis” (NTA) detects and visualizes populations of nanoparticles in liquids down to 10 nm, dependent on material, and measures the size of each particle from direct observations of diffusion. Additionally, NanoSight measures concentration and a fluorescence mode differentiates suitably-labelled particles within complex background suspensions. Zeta potential measurements are similarly particle-specific. It is this particle-by-particle methodology that takes NTA beyond traditional light scattering and other ensemble techniques in providing high-resolution particle size distributions and validates data with information-rich video files of the particles moving under Brownian motion.
This simultaneous multiparameter characterization matches the demands of complex biological systems, hence its wide application in development of drug delivery systems, of viral vaccines, and in nanotoxicology. This real-time data gives insight into the kinetics of protein aggregation and other time-dependent phenomena in a qualitative and quantitative manner. NanoSight has a growing role in biodiagnostics, being proven in detection and speciation of nanovesicles (exosomes) and microvesicles.
NanoSight has installed approaching 600 systems worldwide with users including BASF, GlaxoSmithKline, Merck, Novartis, Pfizer, Proctor and Gamble, Roche and Unilever together with the most eminent universities and research institutes. NanoSight’s technology is validated by 800+ third party papers citing NanoSight results and by the ASTM Standard E2834, consolidating NanoSight’s leadership position in nanoparticle characterization. For more information, visit www.nanosight.com.
What is NTA – how does it work?
NTA visualizes, measures and characterizes virtually all nanoparticles in liquids (10-2000nm dependent on material). Particle size, concentration, zeta potential and aggregation can all be analyzed while a fluorescence mode provides analysis of suitably-labeled particles. NanoSight provides real time monitoring of the subtle changes in the characteristics of particle populations with all of these analyses uniquely confirmed by visual validation.
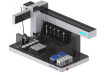
Based on a laser-illuminated microscopy technique, Brownian motion of nanoparticles is analyzed in real-time by a CCD or CMOS camera, each particle is simultaneously but separately visualized and tracked by a dedicated particle tracking image analysis program. The NTA program simultaneously identifies and tracks the center of each particle on a frame-by-frame basis throughout the length of the video – typically 30 seconds. The distance each particle moves in the image is automatically measured. From this value, the particle diffusion coefficient can be obtained and knowing the sample temperature and solvent viscosity the particle hydrodynamic diameter is identified. Because each particle is visualized and analyzed separately the resulting particle size measurement and size distribution does not suffer from the limitations of being the intensity weighted, z-average distribution from DLS. The ability of NTA to simultaneously measure particle size and particle scatter intensity allows heterogeneous particle mixtures to be resolved and particle concentration is measured directly; the particle size distribution profile obtained by NTA being a direct number/frequency distribution. AS this is an absolute method, no user calibration is required. From loading the sample into the cell to getting results can take as little as 2-3 minutes, with the ability to run batches of samples under the same conditions and directly compare results.
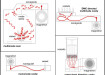
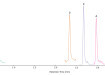
The schematic (above) shows the process of an NTA measurement. Main image shows the particles present in liquid illuminated by the laser. The second shows the individual tracks of each particle. Finally the third shows the distribution of the particles under study.
.jpg)
-(2).jpg)

Digital Edition
Lab Asia Dec 2025
December 2025
Chromatography Articles- Cutting-edge sample preparation tools help laboratories to stay ahead of the curveMass Spectrometry & Spectroscopy Articles- Unlocking the complexity of metabolomics: Pushi...
View all digital editions


Events
Jan 21 2026 Tokyo, Japan
Jan 28 2026 Tokyo, Japan
Jan 29 2026 New Delhi, India
Feb 07 2026 Boston, MA, USA
Asia Pharma Expo/Asia Lab Expo
Feb 12 2026 Dhaka, Bangladesh


