Mass spectrometry & spectroscopy
Launch of Powerful New Spectroscopy Software
Jun 20 2013
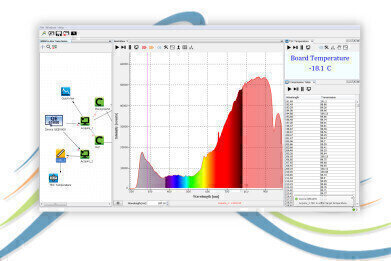
Ocean Optics has released OceanView spectroscopy software, combining powerful data processing capabilities with a clear graphical user interface for use with the Company’s miniature spectrometers. OceanView is highly customisable and includes a schematic view that provides a visual roadmap of data flow from spectral inputs to processed results.
OceanView displays and utilises spectral data from Ocean Optics spectrometers with the added flexibility of integrating temperature, voltage and other input data, allowing users to capture and visualise data from multiple sources. In addition, OceanView saves and reloads previous experiments and has a persistence of settings feature that conveniently recalls acquisition parameters and file locations. Users can customise the OceanView interface once and later access those same settings without having to rebuild them with each new session.
Inspired by customer feedback across a variety of applications, OceanView delivers a high level of experimental control. Its schematic view – a flow chart with each step of the process represented – functions as both a blueprint of the data process from inputs to results and a tool to inspect and modify the process on the fly. It delivers results in the form of an answer, rather than just a simple waveform. More than 70 schematic nodes, or connection points, can be mapped in the schematic view. Other experiment control functions such as spectral splicing, interpolation and device output control are available.
Digital Edition
Lab Asia Dec 2025
December 2025
Chromatography Articles- Cutting-edge sample preparation tools help laboratories to stay ahead of the curveMass Spectrometry & Spectroscopy Articles- Unlocking the complexity of metabolomics: Pushi...
View all digital editions


Events
Jan 21 2026 Tokyo, Japan
Jan 28 2026 Tokyo, Japan
Jan 29 2026 New Delhi, India
Feb 07 2026 Boston, MA, USA
Asia Pharma Expo/Asia Lab Expo
Feb 12 2026 Dhaka, Bangladesh


