Mass spectrometry & spectroscopy
UV-Vis and fluorescence spectroscopy illuminate biological applications
Jun 06 2024
Author: Dr Ursula Tems on behalf of Agilent Technologies
In the intricate landscape of biological research, understanding the behaviour and properties of biomolecules - those tiny building blocks of life - is paramount. UV-Vis (Ultraviolet-Visible) spectroscopy and fluorescence spectroscopy are two powerful techniques that shed light on the otherwise invisible interactions within cells, tissues, and organisms. In this article, we delve into their applications, principles, and the advantages they offer over other methods.
About the technologies
UV-Vis spectroscopy involves shining light in the ultraviolet (UV) and visible (Vis) wavelength regions onto a sample and measuring how much light it absorbs, to provide information about the electronic transitions of molecules. As well as being non-destructive, UV-Vis is a well-established, easy, and fast technique that requires minimal consumables and so is also cost efficient. UV-Vis is used in many biological applications for providing the concentration of a sample, or for characterisation of a sample. For example, protein concentration can be determined by observing the maximum absorbance at a specific wavelength, and the quality of the sample determined by observing the spectra to ensure that there are no contaminants.
The other key use is to measure changes that occur over time, or over different temperatures, for example, monitoring an enzyme assay or a thermal denaturation experiment. Recent advances in UV-Vis technology have enhanced its usability and accuracy, for example the Cary 3500 UV-Vis spectrophotometer can measure eight samples simultaneously, and at four different temperatures simultaneously, ideal for monitoring biological enzymes. In addition to this, some accessories exist that allow users to directly quantify very low volume samples of purified nucleic acid or protein samples without the need for sample dilution.
Fluorescence spectroscopy takes advantage of the intrinsic fluorescence of many biological molecules, such as proteins and nucleic acids. These molecules absorb light (excitation) and emit light (emission) at specific wavelengths. The strengths of fluorescence spectroscopy are specificity, sensitivity, and the ability to analyse molecular interactions, but fluorescence spectroscopy has many additional biological applications and is a widely used workhorse in life science laboratories.
A recent and unique example of how fluorescence spectroscopy can be used in biological laboratories is for screening monoclonal antibodies that are prone to aggregation.
Eight samples at four temperatures simultaneously with the Cary 3500 UV-Vis Multizone Peltier Spectrophotometer.
A fluorescence spectrophotometer is flexible, able to be combined with many types of sample presentation accessories, and in this case a plate reader is used for high throughput. The properties of a fluorescent dye are used to indicate which monoclonal antibody samples aggregate and are therefore not useful for further analysis [1].
The wavelengths at which many biomolecules fluoresce is well characterised, and this can be used to measure the concentration of one type of molecule very specifically in a mixture.
Alternatively, fluorescent molecular ‘tags’ have been designed that can specifically bind molecules of interest, such as proteins or other targets, and the known fluorescence profile of these tags, or how those change when molecules interact can provide a lot of information. Applications of this technique include looking at cell viability, apoptosis, enzyme kinetics and oxidative stress, for example.
Choosing the right technique for biological applications
Applications of UV-Vis for biology
In many cases biological applications require working with nucleic acids or proteins and samples are in low volumes, are difficult to obtain or expensive. UV-Vis spectroscopy is a robust, informative technique that does not require a lot of sample and equally has a strong advantage of not requiring much sample preparation.
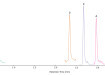
DNA and RNA Analysis: UV-Vis spectroscopy is commonly employed to verify the concentration and purity of DNA and RNA samples. This is particularly important for downstream applications such as sequencing. By assessing the absorbance patterns of these nucleic acids, researchers can ensure the quality and suitability of their samples for further analysis.
Figure 1: A wavelength scan of a DNA sample showing an absorbance level of around 0.5 Abs and 260 nm.
Protein Analysis: In biochemical and biophysical studies, UV-Vis spectroscopy measures the absorbance of proteins at approximately 280 nm due to the absorbance from tryptophan and tyrosine residues. For a pure protein solution, for example assessment of a protein drug, the presence of absorbance at 350 nm can indicate aggregation due to instability.
Bacterial Culture Studies: UV-Vis spectroscopy aids in monitoring bacterial growth and culture ‘optical density’. By measuring the absorbance of bacterial suspensions at approximately 600 nm, researchers can monitor cell proliferation and study the effects of various conditions on bacterial populations.
Enzymatic Reactions: Researchers use UV-Vis spectroscopy to monitor enzymatic reactions. Changes in absorbance during enzymatic processes provide insights into reaction kinetics, substrate utilisation, and enzyme inhibitor activity.
Growth of a bacterial culture for protein expression.
Applications of fluorescence spectroscopy for biology
Fluorescence spectroscopy finds widespread applications in biological research.
Molecular Probes: Fluorescent dyes and probes are essential tools for studying biomolecules. These probes selectively bind to specific targets (e.g., proteins, nucleic acids) and emit fluorescence upon binding. Researchers use them for localisation studies, tracking cellular processes, and detecting molecular interactions.
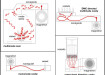
Protein Folding and Dynamics: Fluorescence sheds light on protein folding pathways and dynamics. By attaching fluorophores to specific amino acids, scientists monitor conformational changes in how these molecules interact. Förster resonance energy transfer (FRET) between two fluorophores provides distance information, revealing protein flexibility and stability.
Figure 2: An example of Time Resolved FRET.
Binding Studies: Fluorescence allows us to explore ligand-receptor interactions. When a ligand binds to a receptor (e.g., drug-receptor binding), the fluorophore’s environment changes, affecting its emission properties. Binding constants and dissociation rates can be determined precisely.
A researcher may choose fluorescence spectroscopy to take advantage of the specificity of the technique. When a UV-Vis absorption spectrum of a mixture is analysed, all the molecules in the mixture that absorb light will contribute to the absorbance observed. With fluorescence spectroscopy, generally the excitation wavelength of a specific molecule can be used so that the emission profile that is observed is specific for that molecule.
The benefit of UV-Vis spectroscopy is in the low sample preparation requirement, particularly when analysing a pure sample, such as a purified protein. Many fluorescence assays exist for detecting protein concentration or amount, but these generally rely on the use of a fluorescent dye and can be inaccurate. UV-Vis spectroscopy is preferred for analysing pure proteins as it is a simple and highly accurate technique. UV-Vis spectroscopy can also measure higher concentration samples that might not be measurable using fluorescence due to quenching or inner filter effects.
Synergy: Combining UV-Vis and fluorescence
In many biological laboratories a UV-Vis spectrophotometer will be found next to a Fluorescence spectrophotometer as the techniques are complementary. The combination of the two techniques can provide greater insight for many biological applications and combining detection modes into a single instrument provides researchers with some efficiency gains especially with high throughput applications where microplate readers are used. Multimodal plate readers provide the ability to employ diverse labelling strategies around a particular application area. For example, in the realm of studying kinases, a hybrid microplate reader combing both UV-Vis absorbance and fluorescence (as well as other detection modalities) can be used.
While UV-Vis spectroscopy is ideal for quantitative analysis or characterising enzymes, fluorescence can provide additional information on how molecules interact. Two examples of this are polarisation assays providing fast and quantitative information on molecular interactions, and fluorescence resonance energy transfer (FRET) assays that also take advantage of fluorescent properties of molecules to analyse interactions.
If using the techniques together, the main application and benefit is in the optimisation of both methods. When developing methods, the combined use of UV-Vis and Fluorescence spectroscopy can ensure optimal results. For example, UV-Vis spectroscopy can be used to confirm an excitation wavelength or the concentration of a molecule before it is analysed by fluorescence spectroscopy so that useful data is obtained.
Using the techniques together can also benefit sample optimisation. For lower concentration samples or if the sample is scarce, fluorescence will be a more sensitive technique that requires less initial sample. However, not every molecule fluoresces, and some fluorescence assays can be cost-prohibitive so the simplicity and low sample preparation requirements of UV-Vis spectroscopy may be preferred.
Practical tips for researchers
Sample preparation matters
UV-Vis:
• Ensure sample purity: Contaminants can interfere with absorption measurements. Purify your samples to minimise unwanted signals.
• Use appropriate cuvettes: Choose quartz cuvettes for UV measurements and glass cuvettes for visible range.
• Blank correction: Always measure a blank (solvent) to subtract its absorbance from sample measurements.
Fluorescence:
• Avoid auto-fluorescent materials: Some plastics, glass, or impurities emit fluorescence. Use low-fluorescence materials for cuvettes and containers.
• Dilution effects: High concentrations can lead to inner filter effects or quenching. Optimise sample concentrations for accurate results.
Instrument calibration and validation
UV-Vis:
• Calibrate wavelength accuracy: Regularly check the instrument’s wavelength calibration using standard solutions (e.g., holmium oxide filter).
• Validate linearity: Measure known concentrations of standard solutions to verify linearity within the Beer-Lambert range [2].
Fluorescence:
• Check lamp intensity: Fluorescence lamps degrade over time. Monitor and replace them as needed.
• Validate sensitivity: Use known fluorophores (e.g., quinine sulphate) to validate sensitivity and linearity.
Spectral overlap and multicomponent analysis
UV-Vis:
• Be aware of overlapping spectra: Some molecules have similar absorption profiles. Deconvolute overlapping peaks using mathematical methods.
• Use derivative spectroscopy: Derivative spectra enhance peak resolution, making it easier to identify components.
Fluorescence:
• Spectral unmixing: When multiple fluorophores are present, use spectral unmixing algorithms to separate their contributions.
• Lifetime-based analysis: Fluorescence lifetime measurements provide additional information beyond intensity.
Environmental considerations
UV-Vis:
• Temperature control: Maintain a stable temperature during measurements. Temperature affects absorbance.
• Solvent choice: Different solvents can alter absorption spectra. Choose a solvent compatible with your sample.
Fluorescence:
• Avoid photobleaching: Limit exposure to intense light to prevent fluorophore degradation.
• Shield from ambient light: Fluorescence is sensitive; even room lighting can affect measurements.
Data analysis and interpretation
UV-Vis:
• Baseline correction: Subtract baseline absorbance to remove noise.
• Quantitative analysis: Use calibration curves to convert absorbance to concentration.
Fluorescence:
• Correct for inner filter effects: High concentrations absorb excitation light, affecting emission. Apply correction factors.
• FRET efficiency calculations: Understand FRET efficiency based on donor and acceptor fluorescence.
Conclusion
Individually and when combined, these molecular spectroscopy technologies enable scientists to advance our knowledge and understanding of biomolecules. Both UV-Vis and Fluorescence spectroscopy are simple, cost effective and powerful
for quantification and characterisation and are well-established techniques. Researchers can use both techniques side by side and gain greater insight for biological research.
References
1: Agilent Technologies (n.d.). High-Throughput Fluorescence-Based mAb Aggregation Analysis Solution. Agilent.com. Retrieved May 15, 2024, from https://www.agilent.com/en/product/molecular-spectroscopy/fluorescence-spectroscopy/fluorescence-accessories/high-throughput-fluorescence-based-mab-aggregation-analysis-solution
2: Clark, J. (n.d.). The Beer-Lambert Law. Chem.Libretexts.org. Retrieved May 15, 2024, from https://chem.libretexts.org/Bookshelves/Physical_and_Theoretical_Chemistry_Textbook_Maps/Supplemental_Modules_(Physical_and_Theoretical_Chemistry)/Spectroscopy/Electronic_Spectroscopy/Electronic_Spectroscopy_Basics/The_Beer-Lambert_Law
About the author
Ursula Tems has worked at Agilent Technologies since 2011 in Marketing and Product Management. Ursula is part of the Molecular Spectroscopy business, working on product and portfolio management and strategic planning with a focus on the Pharma and Biopharma end markets. With this experience Ursula is involved in new product design, development, and commercialisation.
Digital Edition
Lab Asia Dec 2025
December 2025
Chromatography Articles- Cutting-edge sample preparation tools help laboratories to stay ahead of the curveMass Spectrometry & Spectroscopy Articles- Unlocking the complexity of metabolomics: Pushi...
View all digital editions


Events
Jan 21 2026 Tokyo, Japan
Jan 28 2026 Tokyo, Japan
Jan 29 2026 New Delhi, India
Feb 07 2026 Boston, MA, USA
Asia Pharma Expo/Asia Lab Expo
Feb 12 2026 Dhaka, Bangladesh


