Air monitoring
Use of deep UV LEDs for highly accurate ozone measurement in industrial, scientific and medical practice
Nov 19 2025
Author:
Prof. Dr. Gerhard Wiegleb
on behalf of Wi.Tec-Sensorik GmbHFree to read
Articles are free to download. Unlock the article to be shown more content, graphs and images.
Ozone is a strong oxidising agent that can cause respiratory irritation and respiratory diseases in humans and animals. The ozone layer in the stratosphere protects living organisms on Earth from damage caused by the sun’s high-energy ultraviolet radiation.
Ozone is mainly used to disinfect water and air and to eliminate odours in areas such as swimming pools, sewage treatment, the food industry and fire damage. It also serves as a powerful bleaching agent in the paper industry and is used medically as ozone therapy.
When used, ozone must always be produced on site and require special safety measures due to its irritating effect.
- Drinking water: Ozone is used to disinfect drinking water and eliminate trace substances.
- Wastewater: It is used to combat bacteria and convert poorly degradable substances into harmless substances.
- Swimming pools: The use of ozone helps to disinfect swimming pool water.
- Disinfection: Ozone can be used to disinfect air and surfaces to eliminate bacteria and viruses.
- Odour removal: It is used to remove odours after fire damage, in hotel rooms, in the fishing industry, in vehicles or in rubbish rooms.
- Bleaching agent: Ozone is an effective bleaching agent, which is mainly used in the paper industry to bleach paper pulp.
- Textile industry: Ozone is also used as a bleaching agent in the textile industry.
- Ozone therapy: Medical applications include the treatment of circulatory disorders, viral infections or skin diseases.
Ozone O3 consists of three oxygen atoms and can therefore be produced directly from oxygen O2 (Eq. 1). This requires energy in the form of UV radiation or an electrical discharge.
This energy ΔH is also referred to as the molar reaction enthalpy.
3O2→2O3; ∆H=+286 kJ/mol (1)
In 1839 Schönbein1 first described the unique phenomenon whereby a chemical element in gaseous form can exist simultaneously in two different molecular forms, namely O3 and O2.
However, ozone spontaneously decomposes back into oxygen, with the half-life being highly dependent on the ambient temperature and possible reaction partners and catalytic surfaces [1].
Table 1. Half-life of ozone [1]
UV-Absorption Spectra
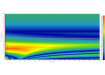
Ozone has a pronounced absorption spectrum with several sub-bands extending from 200 nm into the visible and NIR range. Fig. 1 shows the Hartley, Huggins, Chappuis and Wulff sub-bands.
The strongest band is the Hartley band with a maximum at λ=255 nm, which is mainly used in trace gas analysis. The other bands can be used, for example, for high O3 concentrations.
However, ozone can be detected in the IR range due to its permanent dipole moment. Due to spectral overlaps, this spectral range is rarely used for O3 gas analysis.
Lambert-Beer Law
The absorption of UV radiation occurs according to Lambert-Beer’s law. [5].
I=I0 exp.-[σ∙n∙L] (2)
where I0 and I are the incident and transmitted light intensities, L is the absorption path length (in cm), n is the concentration of the absorber (in molecule/cm3), and σ is the absorption cross section (in cm2 molecule-1).
The following version has become established for practical applications.
I(c)=I0 exp.-[α∙c∙L] (3)
With α = Coefficient of absorption in cm-1 and c = Gas concentration in ppm (10-6).
Fig.1: Spectral position of the individual O3 absorption bands. The bands are not sharply separated from each other and merge continuously into one another.
ULTRA.sens®
Photometric gas analysis is based on Lambert-Beer’s law and is implemented in the commercial ULTRA.sens® photometer as follows.
The use of LEDs for gas analysis was first described in 1983 by Wiegleb [5]. However, powerful LEDs that extend down into the spectral range < 260 nm have only been available for a few years.
A UV LED is used as the radiation source, whose central wavelength is optimally tuned to the center of the O3 absorption spectrum (Hartley band) (Fig. 2).
The radiation from the UV LED is split into a measurement beam and a reference beam by a beam splitter (BS). The measuring beam is directed through the cuvette containing the gas mixture to be analysed.
Both beam paths are detected by separate photodiodes and converted into electrical signals, which are then used to calculate the gas concentration c (Fig. 3). The maximum cuvette length L is 250 mm (AK250) and is suitable for very low O3 concentrations in the ppm and ppb range.
The smallest measuring range is 0-1000 ppb O3. Shorter cuvettes (100 mm) and corrosion-resistant versions in 20 mm and 50 mm are also available for high O3 concentrations, up to the vol.% range.
The ULTRA.sens also has the option of coupling the radiation from a second UV LED into the photometer. The second UV LED can be used, for example, to measure in a different O3 absorption band (Huggins or Chappuis) in order to detect high concentrations in the vol. % range in the same photometer if necessary.
Furthermore, simultaneous NO2 measurement is also possible at the minimum of O3 absorption at 380 nm. This suppresses cross-sensitivity to ozone. This measurement method is used successfully, for example, in the control of low-pressure plasmas.
Furthermore, the ULTRA.sens can be combined with an AutoZeroFunction (AZF) to eliminate zero drift (Fig. 4).
Fig. 2 : Absorption spectrum (red) of ozone in the range from 200 nm to 300 nm (Hartley band) compared to the spectral position of the UV LED emission without additional optical filtering
Fig. 3 : ULTRA.sens® setup with two UV LEDs for simultaneous gas analysis in different measuring ranges (ppm and vol.%) or for simultaneous measurement of O3 and NO2 in a photometric setup
Fig.4 : Illustration of the ULTRA.sens with a 250 mm analysis cuvette (AK250). The AutoZeroFunction (AZF) with the corresponding valve and pump is located below the photometer. The O3 scrubber can also be seen, which also has a fine dust filter upstream.
Calibration the ULTRA.sens
Since there is no test gas for ozone due to its decay properties, the ozone must be generated in real time using an ozone generator. UV radiation sources with a spectrum of λ<200 nm are used as ozone generators, which are particularly suitable for trace ranges (ppm and ppb).
For higher ozone concentrations, plasma discharges are used, which allow O3 concentrations up to the vol.% range. The O3 concentration is determined by using a method in accordance with ISO 13964 [4].
The absorption coefficient α is specified in this standard with a value of 1.44·10-5 m2/µg at 253.7 nm (Hg line). This value is based on the work of Daumont et al. (1992). The calibration of the ULTRA.sens uses this database [2] to calculate the integral absorption across the entire emission range of the UV LED.
To do this, the emission curve must be determined using a monochromator for the UV LED and calculated using the data from [2]. This results in a very high accuracy of the measured values. During practical use, no regular adjustments of the endpoint are necessary.
It is recommended to have the manufacturer perform a check every 1-2 years.
AZF Auto-Zero-Function
Particularly in small trace measurement ranges (0-1000 ppb), the changes in absorption are so small that they can be influenced by temperature effects, humidity [3] and contamination. This leads to a drift in the zero line and thus also to undesirable measurement errors.
To eliminate these measurement errors, an automatic switchover to O3-free air can be performed at a specified time interval (e.g. once per hour). During this phase, the last measured value before switching is stored in the software so that the zero-gas flow does not appear in the output signals (frozen).
Once the current and, if applicable, deviating zero value has been determined, it is set to zero in the software. The measurement then continues as usual. This process typically takes less than 1 minute.
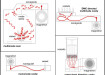
Wi.Tec has developed a special module (Figs. 5 and 6) for this automatic zero-point adjustment, which communicates with the ULTRA.sens® evaluation software. Both, time interval and the purge time can be set over a wide range via the firmware.
Fig. 5: The AZF is a compact module that integrates all necessary pneumatic and electrical components as well as the corresponding connections on a circuit board.
Fig.6: Integration of the AZF in a measurement setup with the ULTRA.sens®. The O3-free air is generated from the ambient air, which is passed through an O3 scrubber, thereby filtering out all O3 components and converting O3 to O2.
Corrosion-resistant design
For use in chemical processes or applications with high ozone concentrations (e.g. >1000ppm), corrosion-resistant analysis cuvettes made of special stainless steels, Monel® or Hastelloy® are recommended.
The cuvette windows are sealed using an O-ring (Viton®, Kalrez® or similar) and a flange connection (Fig. 7). This creates a gas-tight connection and ensures that all components that come into contact with the gas are resistant to the corrosive ozone gas.
Fig. 7: ULTRA.sens® with a corrosion-resistant 20 mm analysis cuvette (AK 20)
Measurement Performance
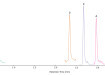
Based on the calibration method described above, the ULTRA.sens® can be used to perform highly accurate O3 gas analyses. Fig. 8 shows the measurement results for a gradual change in O3 concentration in the ppb range.
This enables a measuring range of 0-1000 ppb with a resolution of approx. 5 ppb (Fig. 9). For long-term stable O3 gas analyses, the integration of an AutoZeroFunction (AZF) is recommended. This option allows long-term stable gas analyses to be performed over an unlimited period of time.
Drift is completely compensated for (Fig. 10). There is no cross-sensitivity to other gases in the ambient air (water vapour, carbon dioxide, etc.).
Other substances such as sulphur dioxide (SO2), nitrogen oxides (NOx), etc. can also be measured simultaneously with the ULTRA.sens®, thus compensating for cross-sensitivities if necessary.
The concentration measurement is compensated for gas density via an integrated temperature and pressure sensor, so that this influence can also be neglected.
Fig. 8: Gradual change in O3 concentration using a voltage-controlled ozone generator (silent discharge)
Fig. 9: Determination of the detection limit as 3 times the standard deviation of the O3 measurements at zero point
Fig. 10: Periodic exposure (15-minute intervals) of the structure to zero gas, followed by adjustment of the zero point. The variation in the final value of ±10ppb O3 is due to the unstable generation of the O3 concentration in the ozone generator.
Application Example
One current example of the wide range of possible applications for this innovative gas measurement technology will be cited here. Plant growth (plant physiology) depends on many external factors such as light, humidity, temperature, CO2 concentration and also the O3 content in the ambient air.
For this purpose, the respiratory activity of plants is analysed in special test facilities [7]. One stress factor is the O3 content, which is supplied to the plants in small concentrations.
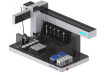
These O3 concentrations can be measured and regulated very precisely using the setup described above. Fig. 11 shows such a setup from the company Plant Invent (Estonia). The device allows parallel non-destructive measurements of stomatal conductance, photosynthesis and transpiration of multiple plants.
Parallel measurements speed up the workflow while also providing more comparable gas exchange data. The cuvette conditions are precisely controlled, and various stimuli can be applied.
Fig. 11: Jyrkki MAX is a multi-cuvette stationary gas exchange device designed to measure bigger plants like cereals, ferns, tomatoes etc. (Plant Invent Estonia)
Summary
The ULTRA.sens gas measurement module from Wi.Tec-Sensorik GmbH described above is characterised by its precise determination of ozone concentrations from trace levels (ppb) up to the industrial vol.% range.
This is achieved through exact mathematical calibration in accordance with ISO 13964. Multi-channel measurement enables high dynamic ranges (ppb to vol.%), which can open up completely new areas of application.
It is also possible to measure other gases (e.g. NO2) in addition to ozone in the same setup. This is helpful in plasma technology application engineering. The versatility of this gas measurement technology was demonstrated using an application example from plant physiology.
References
[1 ] Batakliev et al. : Ozone decomposition. Interdicip. Toxicol. 2014 ; Vol. 7(2) ; 47-59 doi
[ 2] Daumont, D. et al.: Ozone UV spectroscopy I: Absorption cross-sections at room temperature., J. Atmos. Chem.15(2), 145–155 (1992). doi:10.1007/bf00053756
[3 ] Meyer, C. P. et al.: Water vapor interference in the measurement of ozone in ambient air by ultraviolet absorption. Rev. Sci. Instruments. 62(1), January 1991, 223-228.
[4 ] ISO 13964 (1998) Air quality- Determination of ozone in ambient air – Ultraviolet photometric method
[5 ] Wiegleb, G.: Einsatz von LED-Strahlungsquellen in Analysengeräten. Laser- und Optoelektronik No.3/1985, 308-310
[6] Wiegleb, G.: Gas Measurement Technology in Theory and Practice, Springer Verlag Wiesbaden 2023
[7] Merilo, E., et al.: PYR/RCAR Receptors Contribute to Ozone-, Reduced Air Humidity-, Darkness-, and CO2-Induced Stomatal Regulation. Plant Physiology, July 2013, Vol. 162, pp. 1652–1668,
Free to read
Articles are free to download. Please login to read this article or create an account.
Digital Edition
Lab Asia Dec 2025
December 2025
Chromatography Articles- Cutting-edge sample preparation tools help laboratories to stay ahead of the curveMass Spectrometry & Spectroscopy Articles- Unlocking the complexity of metabolomics: Pushi...
View all digital editions


Events
Jan 21 2026 Tokyo, Japan
Jan 28 2026 Tokyo, Japan
Jan 29 2026 New Delhi, India
Feb 07 2026 Boston, MA, USA
Asia Pharma Expo/Asia Lab Expo
Feb 12 2026 Dhaka, Bangladesh


