Mass Spectrometry & Spectroscopy
What’s in my LC/MS spectra?
Apr 13 2021
Author: Charis Lam on behalf of Advanced Chemistry Development, Inc.
The identification of unknowns from complex samples is an intricate puzzle. Using modern techniques, the clues are many: one LC/MS run can produce several hundred time points (a 30-minute run sampled at 0.5 Hz would produce 900), each attached to an MS spectrum. Not all these points are useful though. The deformulation scientist must separate the useful signals from the noise, then work from a series of mass-to-charge signals to a putative structure.
Manually, it’s daunting. With computational help, it’s easier, but without the right help, it can still take longer than tight project deadlines would demand.
A good deformulation workflow should:
1. Accommodate the entire deformulation process. Jumping back and forth between software packages adds unnecessary work.
2. Be simple by default and flexible by design. No matter the sample, the basic deformulation process is the same: deconvolute a chromatogram into individual component traces; then use spectral pattern, retention time, or molecular-ion mass to determine putative structures. The default steps can be automated. But the details may affect performance from sample to sample: for example, differing background noise alters peak-detection accuracy. Thus finer control should be provided when necessary.
3. Allow building of in-house databases as well as searches of commercial ones. Depending on the samples to be analysed and questions to be answered, compounds might be found within large, commercial databases that aggregate information about thousands of chemicals. Or they might be proprietary compounds, known only within a company. Then in-house databases must be built from proprietary data so new spectra can be searched against them.
Here, we present a deformulation workflow for LC/MS data using ACD/MS Structure ID. The workflow is specifically designed for unknown identification via database search, using both spectral matching and formula search of in-house and commercial databases.
Figure 1. A four-step workflow for the identification of unknowns from LC/MS data.
Workflow Overview
Figure 1 illustrates the four steps of the workflow.
1. The sample chromatogram is deconvoluted into its component extracted ion chromatograms (XICs). Each peak in an XIC is associated with its component MS1 and MS2 spectra.
2. The MS2 spectra are searched against a library of known spectra. Putative candidates are identified where matches exist in the database.
3. For compounds not in the database, the molecular ion mass is used to generate a candidate molecular formula. The formula is then searched against more databases to complete the list of candidate structures. Fragment include and exclude lists help to narrow down this search.
4. The raw and processed data, with associated candidate structures, are uploaded to a database, where they can be reviewed from anywhere and accessed by multiple team members.
Example Data
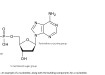
A rat blood sample containing verapamil was analysed by high-res LC/MS/MS with positive electrospray ionisation (ESI), and the analytical data was imported into MS Structure ID. (To demonstrate that the workflow accurately identifies sample components, the data were treated as if the components were unknown, with the intention of ‘discovering’ verapamil and its derivatives.)
Step 1: Deconvolution
Figure 2 illustrates the deconvolution process. The top trace shows the total ion chromatogram (TIC), showing many partially resolved components. The specified data-analysis region is highlighted in white. The trace below, in multi-colour, shows the deconvoluted traces. Each colour represents one component XIC. Components that were unresolved in the TIC are clearly separated among the XIC traces.
At the simplest, deconvolution requires only the click of a button, but the scientist can also fine-tune component separation by adjusting the minimum signal-to-noise ratio, peak shape similarity, and component-identification threshold.
Each component peak is linked to a component mass spectrum, which averages across the signals of that component and removes spurious signals from co-eluting components. If available, both MS1 and MS2 spectra are included.
Figure 2. (top) The partially resolved TIC trace and the separated XIC traces post-deconvolution. (bottom left) A close-up of the data analysis region, showing the clear separation of different components. (bottom right) Each component is associated with its mass spectrum.
Step 2: Spectral Search
After deconvolution, component mass spectra were automatically searched against spectral databases. Matches were populated in a table, which displayed the candidate structure, its molecular formula, the mass difference between the experimental spectrum and the structure’s calculated or databased mass, and a Hit Quality Index (HQI) based on degree of spectral match. The retention time was also shown (and could be used for further filtering).
O-demethylated verapamil was identified as a candidate structure, with a mass difference of 2.995 ppm and an HQI of nearly 90%. The mirror plot showed good concordance between the experimental spectrum (top) and its database match (bottom).
Figure 3. (left) Step 2 identifies compounds by spectral search against databases. (top right) The returned Table of Components shows candidate structures. (bottom right) A mirror plot compares the experimental spectrum against the database spectrum.
Step 3: Formula Search
Some components were not identified through the spectral search since they had no matches in the database. To identify such compounds, the mass-and-formula search was run as shown in Figure 4. First, the mass-to-charge ratio of the molecular ion was turned into a putative molecular formula. Then that formula was searched against more databases to find candidate structures.
The bottom-left panel of Figure 4 shows the formula generator, which takes as input an m/z value and various elemental constraints. In this example, the compound with m/z 455.291322 was assumed to contain H+, H, and C, and possibly N and O. Constraints were also set on the number of atoms of each element. Since the target was a small molecule ionised by positive ESI, H+ was set to 1. Constraints were wider for C and H, but far more C and H were expected than N and O, as is reasonable.
Figure 4. (top) Cartoon showing an accurate mass being converted to a candidate molecular formula. The formula is searched against chemical databases. Fragment include and exclude lists narrow down the search results. (bottom left) Part of a dialogue box showing the formula-generation step. (bottom right) The identified structure, verapamil.
The formula generator returned a candidate molecular formula of C27H39N2O4. The error between the experimental and theoretical mass was 1.949 ppm, and the formula fit quality (based on isotopic pattern) was 0.980 (out of 1).
A mass-and-formula search was then run against more chemical databases. Inputs for the search included the mass, the type of ion expected ([M+H]+), the elemental composition, and an include list. The elemental composition can be exact, or it can be a range. For example, the candidate formula of C27H39N2O4 can be expanded to the formula range of C(27–30)H(36–38)N(2–3)O(1–4) to return fuzzy matches.
Since more matches are expected from a mass-and-formula search than from a spectral search, include and exclude lists narrow down the candidates. As Figure 4 shows, these lists specify fragments that are expected (or not expected) within the molecule. Such information might come from a priori knowledge about the sample, or from other techniques like IR, which give insight into functional groups.
The mass-and-formula search correctly identified verapamil as the top candidate.
Step 4: Databasing
The completed project was uploaded into a shared database. The database record contained all the information generated at each step: the unprocessed chromatogram, the XIC traces, associated spectra, component masses and retention times, candidate structures, references to the database record for each match, and more. Thus the information can be reviewed at any depth, by anyone with database access, making collaboration easier.
An All-in-One Workflow for Unknown Identification
This workflow fulfils all the criteria identified in the introduction.
1. It accommodates the entire deformulation process. From the user’s perspective, deconvolution and spectral search are performed in a single step. (Though of course the software operates sequentially.) Mass searching is added as necessary, but it occurs within the same interface. All necessary information, from TICs to XICs to spectra to structures and more, are viewed within the same window, making it easy to compare information and understand the entire project at once.
2. The workflow replicates what can be replicated: the simple four-step process of deconvolution, spectral search, mass search, and databasing. Thus, the basics are simple, and if default settings work (or if many similar samples can be analysed with the same settings), it’s nearly as simple as clicking a few buttons. But fine-grained control over individual settings is also available to tailor the workflow to specific needs.
3. The example included searching of both in-house and commercial databases. In addition, the software itself allows creation of databases, so scientists can easily expand the number of searchable spectra by adding new spectra to databases as they’re collected. Since databases can be shared by entire organisations, this knowledge can rapidly spread across and among teams.
Conclusion
LC/MS remains one of the most widely used methods for deformulating complex samples. Its sensitivity and resolving power help with chemical separation and detection, but turning that data into known structures is still a complicated task. However, as this paper shows, dedicated tools can simplify the process.
Digital Edition
Lab Asia 31.2 April 2024
April 2024
In This Edition Chromatography Articles - Approaches to troubleshooting an SPE method for the analysis of oligonucleotides (pt i) - High-precision liquid flow processes demand full fluidic c...
View all digital editions


Events
Apr 28 2024 Montreal, Quebec, Canada
May 05 2024 Seville, Spain
InformEx Zone at CPhl North America
May 07 2024 Pennsylvania, PA, USA
May 14 2024 Oklahoma City, OK, USA
May 15 2024 Birmingham, UK


