Emissions of air pollutants in the UK – Sulphur dioxide (SO2)
Updated 19 February 2024

© Crown copyright 2024
This publication is licensed under the terms of the Open Government Licence v3.0 except where otherwise stated. To view this licence, visit nationalarchives.gov.uk/doc/open-government-licence/version/3 or write to the Information Policy Team, The National Archives, Kew, London TW9 4DU, or email: psi@nationalarchives.gov.uk.
Where we have identified any third party copyright information you will need to obtain permission from the copyright holders concerned.
This publication is available at https://www.gov.uk/government/statistics/emissions-of-air-pollutants/emissions-of-air-pollutants-in-the-uk-sulphur-dioxide-so2
1. What is sulphur dioxide and why are emissions of it estimated?
Sulphur dioxide (SO2) is a corrosive, acidic gas which is predominantly produced from the combustion of coal or crude oil.
Direct exposure to SO2 is associated with asthma and chronic bronchitis, and can lead to irritation and constriction of the airways. SO2 emitted from coal burning played a key contributory role to thousands of respiratory-related deaths during the London smog in 1952. SO2 can also combine with nitrogen oxides and ammonia to form particulate matter (PM) which also has serious health implications (see the PM section in this release for more information on the health impacts of PM).
SO2 can also combine with water vapour in the atmosphere to form acid rain that can be transported large distances. Acid rain causes significant damage to ecosystems such as forests and freshwater habitats. Emissions of SO2 from the UK that landed as acid rain in Scandinavia in the 1970s and 1980s resulted in severe damage to habitats there. The international discussions surrounding the discovery of these transboundary impacts were the initial driver for establishing the Convention on Long Range Transboundary Air Pollution (CLRTAP), of which the UK is a founding member.
SO2 can be emitted both by natural processes, such as forest fires, and as a result of human activities, such as the combustion of fuels. The National Atmospheric Emissions Inventory, and the statistical tables published as part of this release, only covers SO2 emissions from human activities. The information presented in this document only covers SO2 emissions from human activities within the UK.
UK emissions of SO2 from energy production have been vastly reduced in recent decades due to restrictions on the sulphur content of fuels and the closure of coal-fired power plants. However, the UK, under the CLRTAP and National Emission Ceilings Regulations (2018) (NECR), aims to reduce SO2 emissions even further: by 59 per cent compared to 2005 emissions by 2020 and in each subsequent year up to and including 2029 (and by 88 per cent compared to 2005 emissions by 2030).
2. Trends in total annual emissions of sulphur dioxide in the UK, 1970 to 2022
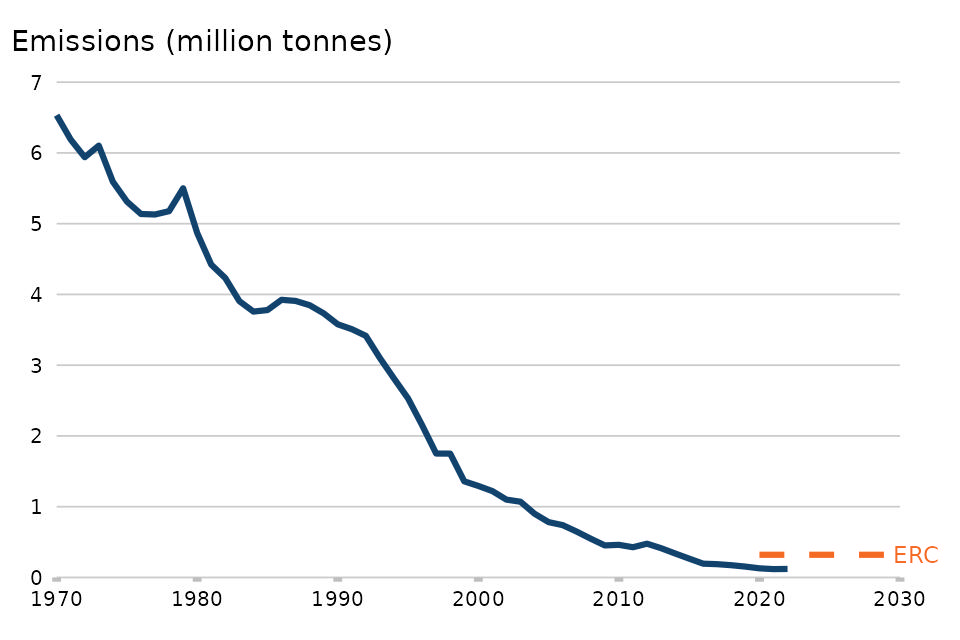
Figure 12: Annual emissions of sulphur dioxide in the UK: 1970 – 2022
Note:
- ‘2020-2029 ERC’ refers to the UK’s emission reduction commitments, set out in the National Emission Ceilings Regulations (2018)/Convention on Long Range Transboundary Air Pollution.
Download the data for this chart in CSV format
Emissions of sulphur dioxide have decreased by 98 per cent since 1970, to 120 thousand tonnes in 2022. This was driven by a decline in coal use in the energy sector. Emissions from coal in the energy sector decreased by 9 per cent from 1970 to 1991. From 1991, emissions decreased more rapidly, by 83 per cent between 1991 and 2005 and then by a further 99 per cent from 2005 to 2022. Stricter limits being placed on the sulphur content of liquid fuels has also reduced emissions in the long-term. Emissions of SO2 have increased by 2 per cent from 2021 to 2022 after having reached the lowest level in the time series in 2021. However, emissions have remained lower than pre-2021 levels of emissions.
For emissions of sulphur dioxide, there is an annual ceiling of 321 thousand tonnes applicable between 2020 and 2029. In 2022, there were 120 thousand tonnes of sulphur dioxide emitted. Therefore, the UK did meet the 59 per cent emission reduction commitment for 2020 to 2029.
3. Major emission sources for sulphur dioxide in the UK
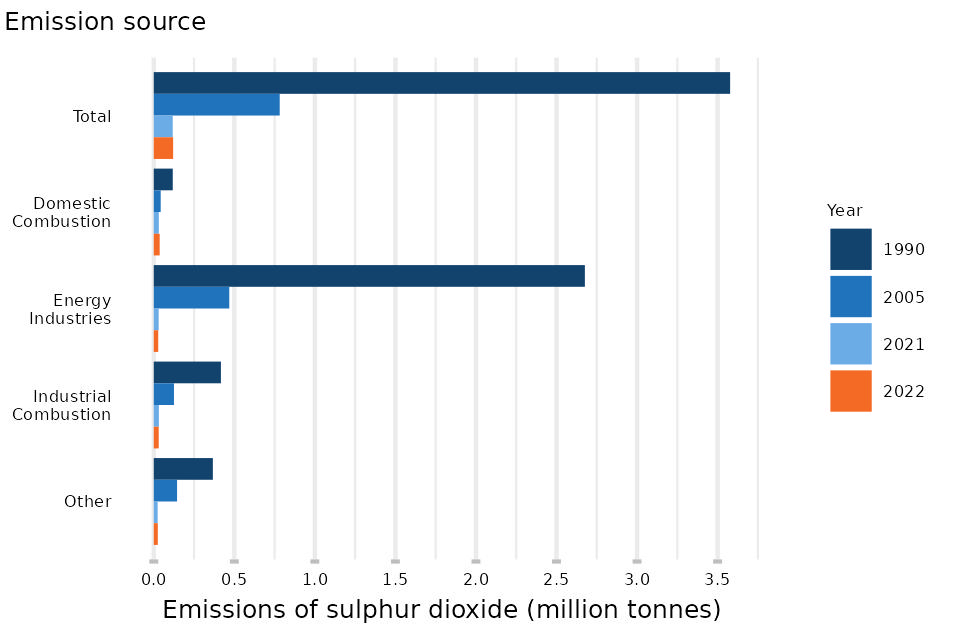
Figure 13: UK annual emissions of sulphur dioxide by 2022 major emission source: 1990, 2005, 2021 and 2022
Notes:
-
‘Industrial combustion’ refers to the burning of fuels on manufacturing and construction sites, to generate energy for industrial use, for example to drive mobile machinery or to create heat or electricity for industrial processes. This does not include emissions from combustion in the agricultural, forestry and fishing sectors, from the public sector, from the commercial sector, or emissions from energy industries.
-
‘Energy Industries’ refers to combustion in energy industries, for public power, heat production and the production of solid fuels. This does not include any fugitive emissions (losses, leaks and other releases of gases) related to these activities.
Download the data for this chart in CSV format
In 2022 the three largest sources of SO2 emissions were domestic combustion (31 per cent of national total), industrial combustion (26 per cent of the national total) and fuel combustion in energy production and transformation (23 per cent of national total). Industrial combustion refers to the burning of fuels on manufacturing and construction sites to generate energy for industrial use, such as to produce heat, electricity or to drive mobile machinery.
Emissions reductions from energy production and industrial sectors have been the strongest drivers for the long-term trend of decreasing emissions. This is due to a shift away from high sulphur fuels (i.e. coal) to low sulphur fuels (including conversion to gas and biomass fuel) and the fitting of flue gas desulphurisation in the remaining coal fired plants in the power sector. Emissions from combustion in energy industries have decreased by 99 per cent between 1990 and 2022, while emissions from industrial combustion have decreased by 93 per cent since 1990.
The decrease in SO2 emissions in recent years, with UK emissions having decreased by 75 per cent between 2012 and 2022, was largely due to the closure or the conversion to bio-fuels of many coal-fired power stations. This has significantly reduced the overall coal-burning capacity in the UK’s power stations.
Levels and trends in emissions from specific sources are available for the period 1990 to 2022 through the statistical tables that accompany this release.
4. Sections in this release
Emissions of particulate matter (PM10 and PM2.5)
Emissions of non-methane volatile organic compounds
Methods and quality processes for UK air pollutant emissions statistics (PDF)