Air Monitoring
Atmospheric Carbon Dioxide Monitoring Close to a Coal-Fired Power Plant and a Cement Factory
May 07 2014
Author: Kuo Ying Wang on behalf of Department of Atmospheric Sciences
The burning of fossil fuels remains a main source of energy for powering today’s global economy. No single and significant process has been discovered in the past 300 years that is capable of relieving man’s dependence on fossil fuel energy. There is not one industrial country in the world that doesn’t burn fossil fuels. When compared with the significant advances in computer and mobile communication technologies, advances in energy technologies have moved at a relatively slow pace. So what is going on? Cheap prices play a key role here. The low cost of generating large-scale power per watt from fossil fuel burning is of huge importance when compared with other methods. In saying that, there is a flaw - the cost of climate change, resulting in the CO2 accumulation from fossil fuel usage, should be included in the calculation [5].
Relentless burning of fossil fuels releases huge amounts of carbon dioxide (CO2) into the atmosphere. In 2010, a huge amount of energy was produced, while 30-billion tons of CO2 were released as a by-product [see Chapter 7 of ref. 2]. It is estimated that in 2050 the amount of CO2 emissions will be 70 billion tons, and 90 billion tons by 2100 [2]. The chemically inert nature of CO2 enables it to stay in the air for more than 100 years; the average atmospheric residence time for CO2 is 120 years, far longer than the average life span of a person.
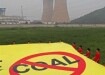
Currently, there are around 30,000 coal-fired power plants in the world (Figure 1). Energy from these power plants is the backbone of the current global economy. A few percent of the 6.7 billion people globally may reap the reward of fossil-fuel consumption. However, climate change associated with rising CO2 levels is going to affect everyone, as well as the entire ecosystem. The future is very uncertain as CO2 levels reached a record of 400 parts per million by volume (ppmv) during early 2014 [6], and is still rising steadily. We are currently living in an atmosphere that contains the highest recorded levels of CO2 for the past 800 thousand years (Figure 2).
Effects of Increase in CO2 in the Atmosphere
So what will be the effect of the additional anthropogenic atmospheric CO2? The atmosphere is not an independent entity - it interacts with the oceans, terrestrial biosphere, land surfaces, etc.
Flying simulators, where pilots conduct numerous simulations without the need of an actual plane, are very valuable in helping pilots to build the skills and knowledge needed to fly aircraft. Similarly, we need to use three-dimensional (3D) computer models of earth systems to accurately simulate climate change, and atmospheric CO2. Figure 3 shows a list of climate simulations for global and continental temperature changes in the 20th century. The models run simulations of temperature change both without (blue colored shading) and with (pink colored shading) the effect of anthropogenic emissions. The model with effects from anthropogenic emissions show a significant temperature increase after 1960, and this temperature trend is similar to actual observations. On the contrary, the model without the effect of anthropogenic emissions shows no significant temperature rise after 1960. Actually, the model without effect of anthropogenic emissions shows weak temperature variations around 0 degree Celsius, while the model with the effects of anthropogenic emissions included shows a gradual increase in temperatures before 1960, and a significant increase in temperatures after 1960. Figure 3 is a very important plot, clearly showing the effect of anthropogenic emissions on the atmosphere.
How the increase in CO2 is related to temperature increase
In Figure 3 we see that model simulations with anthropogenic factors included can reproduce global temperature changes during the 20th century. These models can now be used to provide projections of future temperature change with respect to the different CO2 concentration scenarios. Figure 4 shows simulations of the 21th century temperature changes with CO2 scenarios. Here RCP2.6 means simulation with CO2 reaching 421 ppmv (or CO2 eq = 475ppmv, ranging between 450 ppmv – 500 ppmv), RCP4.5 means CO2 reaching 538 ppmv (CO2 eq = 630 ppmv), RCP6.0 means CO2 reaching 670 ppmv (CO2 eq = 800 ppmv), and RCP8.5 means CO2 reaching 936 ppmv (CO2 eq = 1313 ppmv) at 2100. It is clear that in order to control global mean temperature changes at current levels, atmospheric CO2 levels must be limited to 421 ppmv by 2100. An increase in CO2 levels above that level pushes global mean temperatures higher up.
How temperature increase is related to risk for society
A warming world is expected to create a more hazardous environment than the environment we currently enjoy. For example, it is very likely that we are going to encounter more extensive heat wave, drought events, heavy rainfall and flooding (Figure 5). It is difficult to imagine the difficulty of not having tap water in the morning to wash or to flush the toilet. These are not trivial things. These are the things that we have taken for granted for a long time. In the coming years, things can change swiftly. Think what another hurricane like Katrina can do to a first-world country [7].
What needs to be done to prevent temperature increase?
In order to stabilise atmospheric CO2 levels, and to limit the global temperature rise to 2oC by 2100, we need to control CO2 emissions so that CO2 eq will be limited to 450 ppmv to 500 ppmv. Figure 6 shows time-series plots of atmospheric CO2 eq emissions that must have so that the goals of limiting CO2 eq = 450 ppmv and CO2 eq = 500 ppmv, respectively, by 2100 can be achieved. It is clear that emissions of CO2 eq can only be peaked around 2020, followed by the reductions in the emissions of CO2 eq in order to limit the rising temperature with 2oC by 2100. This is the science behind the Cancun Pledges shown on the upper left panel of Figure 6.
What must be done: countering relentless CO2 emissions with tireless CO2 monitoring
Despite a temporary halt in rising temperatures since 2003 (), the increase in atmospheric CO2 levels have been less ambiguous. We note that 400 ppmv of CO2 was measured at Mauna Loa in Hawaii, in the remotely clean atmospheric environment of the central north Pacific. If CO2 were monitored in the vicinity of huge CO2 emitters, such as coal-fired power plants, oil refinery facility, and industrial parks area (a ref to my APR article), the actual situation would be bleaker than people may imagine.
Interestingly, most of ambient monitoring stations were not set up close to power plants, oil refinery facilities, or industrial park areas. Also, CO2 has not been routinely monitored. In the context of climate mitigation (a ref. to AR5), this situation ought to change as scientists strive to learn more about the amount of CO2 emitted from such places. The monitoring of ambient CO2 levels is an important step in verifying the effectiveness of CO2 reduction.
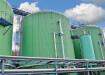
In this work we demonstrate continuous CO2 in-situ monitoring at sites close to a coal-fired power plant and cement factory (Figure 7) in Taiwan. These facilities are typical hallmarks of the fossil fuel burning lifestyle that we enjoy today.
We have used a high standard of CO2 analyser to conduct continuous in-situ ambient CO2 monitoring since 2009. The CO2 analyser uses non-disperse infrared (NDIR) principles to measure CO2 levels in the air. The outlet of the CO2 analyser and the measurement set up are shown in Figure 8 [3,4]. In order to keep CO2 measurements traceable to the international standards set by the World Meteorological Organization (WMO), each CO2 analyser is equipped with two CO2 working standards for conducting regular calibration during the measurements (Figure 9). These two working standards contain one at low CO2 concentrations (span-1, 350-375 ppmv), and the other one at high CO2 concentrations (span-2, 550-575 ppmv). These CO2 working standards were calibrated against WMO CO2 primary standards obtained from the United States (US) National Oceanic and Atmospheric Administration (NOAA) Earth System Research Laboratory.
Figure 10 shows a time-series plot of 1-min average CO2 concentrations measured in the monitoring site shown in Figure 7 from 28 January – 27 February 2013. The 1-min monitoring data reveals background CO2 levels close to 400 ppmv, which is similar to the CO2 levels measured at Mauna Loa. Most strikingly, the 1-min monitoring data shows elevated levels of CO2 higher than 450 ppmv that are frequently occurred in the data. This is a typical one month of monitoring data seen in this site which is characterised by a coal-fired power plant and a cement factory.
If Figure 10 is representative of what CO2 levels one expects to see in the ambient air of a coal-fired power plant, then the application of this to the 30,000 coal-fired power plants shown in Figure 1 implies a staggering amount of elevated CO2 being continuously produced and accumulated in these hot spot areas. This is the flavour of the true CO2 emitting power and the true CO2 levels not frequently seen in the report. Given the fact that we have to limit atmospheric CO2 levels to below 450-500 ppmv by 2100 in order to limit global temperature increase to within 2oC, the CO2 levels in the ambient air surrounding the monitored coal-fired power plants already go beyond and far beyond 500 ppmv. This is a mechanism that clearly warns us of a warming climate, extreme weather, and, ultimately, a hazardous future.
Concluding remarks
Since the beginning of industrial revolution in the 18th century from England, humans have been burning fossil fuels [2]. Most industrialised countries are located in the mid to high latitudes where the annual mean temperature is low compared with countries in lower latitudes. For these industrialised countries, keeping warm during the cold winter weather is more concerning than warnings about a warming world, because temperatures even in summer are not very high (with the exception of the 2003 European heat waves, ref. 8).
As such, people living in industrialised countries tend to have more motivation to fight low temperatures than concerns about a warming world. In a cold environment, a warming world may not be that bad at all.
These industrial countries are also politically powerful.
Hence, their attitude toward a warming world is understandably more hesitant and less determined than facing the problem of the ozone hole in stratosphere. Ozone hole phenomenon affects more countries in the mid to high latitudes than those in low latitudes. A decision to sign the Montreal Protocol may partially mitigate the risk of the ozone hole. For these industrial countries, a warming world may simply be not as urgent a problem.
These concerns, or lack of, really are worrisome. Interestingly, the outcome of no action in curbing CO2 emissions and controlling a rising temperature is projected to have a big impact in industrialised countries as climate change reveals itself further during this century [1,2].
References
1. IPCC, 2013: Summary for Policymakers. In: Climate Change 2013: The Physical Science Basis. Contribution of Working Group I to the Fifth Assessment Report of the Intergovernmental Panel on Climate Change [Stocker, T.F., D. Qin, G.-K. Plattner, M. Tignor, S.K. Allen, J. Boschung, A. Nauels, Y. Xia, V. Bex and P.M. Midgley (eds.)]. Cambridge University Press, Cambridge, United Kingdom and New York, NY, USA,in press.
2. Climate Change 2014: Mitigation of Climate Change. Working Group III Contribution to the IPCC 5th Assessment Report - Changes to the Underlying Scientific/Technical Assessment to ensure consistency with the approved Summary for Policymakers (XXXIX/Doc.17) and presented to the Panel at its Thirty-Ninth Session.
3. Wang, K.-Y., H.-C. Chien, and J.-L. Wang (2011), Development of low-cost network of sensors for extensive in-situ and continuous atmospheric CO2 monitoring, in Monitoring, Control and Effects of Air Pollution, pp. 60-72, InTech Open Access Publisher, ISBN: 978-953-307-526-6 .
4. Wang, K.Y., Wang, J.L., Liu, W.T., 2014. Ambient carbon dioxide concentrations in industrial park areas: A monitoring and modeling study. Atmospheric Pollution Research 5, 179-188, doi: 10.5094/APR.2014.022.
5. Costanza, R., Kubiszewski, I., Giovannini, E., Lovins, H., McGlade, J., Pickett, K.E., Ragnarsdottir, K.V., Roberts, D., De Vogli, R., Wilkinson, R. (2014). Time to leave GDP behind, Nature, 505, 283 - 285.
6. Monastersky, R. (2013). Global cargon dioxide levels near worrisome milestone, Nature, 497, 13-14, doi:10.1038/497013a.
7. Quinn, S.C. (2006). Hurricane Katrina: A social and public health disaster, American Journal of Public Health, 96, 204.
8. Beniston, M. (2004). The 2003 heat wave in Europe: A shape of things to come? An analysis based on Swiss climatological data and model simulations. Geophysical Research Letters, 31(2).
Digital Edition
IET 34.2 March 2024
April 2024
Gas Detection - Biogas batch fermentation system for laboratory use with automatic gas analysis in real time Water/Wastewater - Upcycling sensors for sustainable nature management - Prist...
View all digital editions


Events
Apr 22 2024 Hannover, Germany
Apr 22 2024 Marrakech, Morroco
Apr 23 2024 Kuala Lumpur, Malaysia
Apr 23 2024 Kintex, South Korea
Apr 23 2024 Edmonton, AB, Canada


