Measurement and Testing
Will Your Oil in Water Analysis Method Match the Regulatory Method?
Jan 08 2013
Author: Sandra Rintoul on behalf of Wilks Enterprise Inc
The analysis of oil in water is a worldwide problem that crosses many industries, analytical methods and regulatory agencies. For those in the petroleum industry, the offshore platform oil and grease limits for produced water can be quite different from the effluent coming out of the refinery. For the expanding hydraulic fracturing industry, oil in water limits are driven by whether the frac or produced water will be treated for reuse, disposed of down an inactive well, or sent off-site for treatment.
Those individuals tasked with having to determine the amount of oil in water know it can be a challenging measurement. It is complicated by the fact that oil comes in many forms and is not a unique chemical entity. Added to the chemical non-uniformity is a number of different analytical methods that could be used, ie: solvent extraction/gravimetric, gas chromatography, solvent extraction/infrared, and solvent extraction/UV to name a few.
The measurement is, therefore, defined by the particular regulatory method used to measure it. When EPA 1664 is the regulatory method, the “oil” is anything that is extracted into hexane and remains after the hexane has been evaporated and shows up as weight. In regions where infrared analysis is the defining method, the “oil” is whatever is extracted into the solvent and has carbon-hydrogen bonds that absorb infrared light at a specific frequency. Each method is looking at different properties of oil and can potentially give different results.
The answer to the commonly asked question of how one type of oil in water measurement compares with different regulatory methods is not always simple and straightforward. Listed below are four factors that need to be considered:
1. Precision and bias for each method
There are acceptable errors for each method typically expressed in the precision and bias statement for the method. For example, EPA Method 1664 states in their "Ongoing precision & recovery" (section 17.0) that for a 100 ppm sample the acceptable range is 78 -114 ppm. If the test includes the silica gel treatment (SGT) to remove the polar organics, the acceptable range is 64 – 132 ppm. Therefore, if the result from a laboratory for a silica gel treated sample is 65 ppm and the alternate method result is 130 ppm, they are within the acceptable range.
2. Operator errors
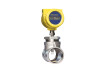
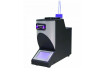
As suggested previously, even the same method can give significantly different results. With any method where there is sample preparation, the human factor is added in. If a solvent/sample mix is only shaken for one minute rather than the required two minutes, the amount of oil extracted into the solvent will be significantly less. In some cases, it has been half the reading. The chart below shows a comparison of a five way sample split that was analysed on two InfraCal TOG/TPH Analysers (see photo) using infrared analysis and at three laboratories using the EPA 1664 hexane/gravimetric method. The results disprove the common misconception that the lab is always right.
3. Sampling
Sample collection and handling can cause differences for comparative testing. In order to have an objective comparison, the samples should be identical. If there is variability in the waste stream, this can be a difficult task. The old adage that oil and water do not mix holds true for wastewater as well.
Oil also likes to stick to surfaces. If sample collection containers are being reused, they should get a final solvent rinse after cleaning to remove any residual oil. For sample analysis, the solvent should either be blended in the sample container or if the sample is to be transferred to another container, the sample container should be rinsed with a portion of the solvent that will be used for the extraction. If not, any oil on the container surface will be excluded from the reading.
4. Sample Disparities
Not all oil in water samples are alike which makes it difficult when comparing analytical methods that look at different properties of the oil in order to make the measurement. Oil is a mix of chemical components that changes from one location to another--it can even change at the same location.
For example, samples often contain a mix of aromatic and aliphatic hydrocarbons. UV fluorescence only detects aromatic hydrocarbons while infrared will detect both aromatic and aliphatic hydrocarbons. The two analytical methods could give different results if the aromatic/aliphatic ratio changes.
Samples that contain volatile hydrocarbons could also show different results between EPA 1664 and an infrared transmission method. With the 1664 gravimetric method, any volatile oils below the boiling point of hexane will be evaporated off with the solvent. With an infrared method using a transmission cell, the oil is measured directly in the solvent without evaporation and the volatile hydrocarbons will be retained. This will make a transmission infrared reading higher than an EPA 1664 result if the sample has volatile oils.
While all of the considerations listed above make it look like any correlation could be difficult, by using careful analytical procedures, understanding the composition of the waste stream and knowing the limits of each measurement system, useful information can still be generated. The table to the left shows samples from on an oil rig in the North Sea that were tested by a laboratory using EPA 1664 and the InfraCal TOG/TPH Analyser, Model HATR-T2 (see photo) which uses hexane as an extraction solvent. With this infrared method the hexane is evaporated off prior to measurement so the volatile hydrocarbons will not be retained and should give a reading closer to the hexane/gravimetric method. This example shows that infrared analysis, which has been used off-shore for over 40 years, can be a valuable tool in assessing if an oil separation system is performing to the required specifications.
So, the answer to the initial question as to whether one analysis method will match another is that most methods will typically correlate closely enough to provide operators with the information necessary to make sure their effluent does not exceed the regulatory limit. Will the numbers match exactly? Sometimes…
Note: For a more in depth review of this topic, please see the write up by Dan Caudle of Sound Environmental Solutions, Inc. for the Oil in Water Monitoring Workshop 2002 titled “Sources of Error in Oil in Water Measurements and their Impact on Comparing Oil in Water Monitors”. http://www.wilksir.com/pdf/SourceforErrors.pdf
Digital Edition
PIN 25.1 Feb/March
March 2024
In This Edition Safety - The technology behind the ION Science Tiger XT - Safety with ammonia and LOHCs as hydrogen carriers Analytical Instrumentation - Discussion on new tribology te...
View all digital editions


Events
Apr 22 2024 Hannover, Germany
Apr 22 2024 Marrakech, Morroco
Apr 22 2024 Muscat, Oman
Apr 22 2024 Rotterdam, Netherlands
Apr 23 2024 Singapore


