Mass Spectrometry & Spectroscopy
Fusion Protein Complexes Analysed by CG-MALS - Non-equivalent, Multivalent Interactions
Nov 11 2019
Author: Sophia Kenrick on behalf of Wyatt Technology Corporation
Quantifying binding affinity between species with multiple binding sites can present a significant challenge to many biophysical characterisation techniques. Composition-gradient multi-angle light scattering (CG-MALS) provides direct measurement of affinity and absolute stoichiometry for a wide variety of interactions, including multivalent interactions, without the need for surface immobilisation or tagging.
A model fusion protein, Y, was engineered with two binding sites for its ligand, X. The interaction was quantified using two CG-MALS experiments. The first experiment quantified the interaction between X and Y at a high-affinity binding site and suggested the presence of a second low-affinity binding site. A simulation based on these results led to the design of a follow-up experiment to quantify the affinity at the weaker binding site and confirm that no additional higher order species were formed.
The Molecular Interactions Research Group (MIRG) of the Association of Biomolecular Resource Facilities (ABRF) developed two proteins to use as a model system for investigating multivalent interactions. In 2012, these proteins were used in a benchmark study to test the capabilities of common molecular interaction technologies. Proteins X and Y were sent to a panel of participants with specific instructions for analysing the interaction via surface plasmon resonance (SPR) to determine the binding affinity and stoichiometry. Instructions were given for immobilising protein Y as the ligand in the SPR assay, and the organisers recommended sampling analyte (protein X) concentrations of 1 nM to 300 µM.
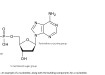
For illustrative purposes only. Binase fusion protein (multi-coloured, pdb1BUJ and pdb2RBI) and two barstar molecules (red, pdb2HXX).
The results were presented at the 2013 ABRF Annual Meeting in Palm Springs at the conclusion of the study [1,2], and it was revealed that protein Y was an engineered fusion protein of two binase mutants (H102Q and R59A/H102Q). Each part of the fusion protein was capable of binding a barstar mutant (Y29A, C40A, C82A) but with significantly different affinity. The binase fusion protein (protein Y) had a molar mass of 26.3 kDa, and the molar mass of barstar (protein X) was 11.9 kDa [3].
Extensive binding studies had been performed with SPR, isothermal titration calorimetry (ITC), and analytical ultracentrifugation (AUC) to quantify the affinity at each site (Table 1) [1,3]. Interestingly, the measured affinities for the ‘solution’-based measurements - ITC and AUC - are at least 10x stronger (lower Kd) than those for surface-based SPR, presumably due to electrostatic interactions with the chip surface.
Table 1. Summary of measured binding affinities between barstar to bivalent barnase fusion, as measured by different techniques.
Technique Measured Binding Affinity, Kd (µM)
Binding Site 1 Binding Site 2
SPR 0.350 ± 0.140 79 ± 45
ITC 0.008 – 0.034 3 – 17
AUC 0.005 – 0.040 16 – 46
To adapt the SPR experimental guidelines for a CG-MALS experiment, the CALYPSOTM software’s simulation tool was used to identify stock concentrations that would provide quantitation of a wide range of affinities and stoichiometries. Interactions with Kd ranging from 10 nM to 10 µM and between 1 and 4 binding sites were considered. As a result of the simulations, stock concentrations of 4.8 µM protein X and 800 nM protein Y were chosen to provide Kd between 10 nM and 1 µM. The simulation helped determine that analysis of weaker affinities or complex stoichiometries requires a second experiment, where the results of the initial measurement are used to optimise conditions for the second experiment.
Materials and Methods
Reagents and instrumentation
Proteins X and Y were provided by the MIRG Benchmark Study at concentrations of
9 mg/mL and 2.68 mg/mL, respectively. All experiments were performed in acetate buffer (50 mM NH4CH3COO, 100 mM NaCl, 0.1% EDTA, 0.01% NaN3, pH 8.0) filtered to 0.1 µm.
The interaction between proteins X and Y was quantified by composition-gradient multi-angle static light scattering (CG-MALS), automated by the Wyatt Calypso® system. Inline filters of 0.1 µm pore size were installed in the Calypso. Protein and buffer solutions were delivered by the Calypso to a UV/Vis concentration detector (Waters) and DAWN® MALS detector.
Protein solutions were prepared at the stock concentrations specified for each experiment, filtered to 0.02 µm, and loaded onto the Calypso. The Calypso prepared different compositions of protein X, protein Y, and buffer, and delivered the mixed solution to the MALS and UV detectors according to the automated methods described below. After each injection, the flow was stopped to allow the interactions to come to equilibrium.
Experiment 1
Proteins X and Y were diluted to ~0.05 mg/mL and ~0.02 mg/mL (~0.8 µM and ~4.8 µM), respectively, in running buffer and filtered to 0.02 µm prior to loading on the Calypso. The experiment consisted of three composition gradients: 1) a concentration gradient in protein Y to quantify its molecular weight and any self-interactions, 2) a hetero-association (‘crossover’ gradient) consisting of fourteen compositions of X and Y to identify the interaction affinity and stoichiometry, and 3) a concentration gradient in protein X to quantify its molecular weight and any self-interactions (Figure 1, left). After each injection, the flow was stopped for 60 seconds (single-component gradient) or 180 seconds (crossover gradient) to allow the solution to come to equilibrium.
Experiment 2
Proteins X and Y were diluted to ~0.1 and ~0.4 mg/mL (~30 and ~3 µM), respectively, in running buffer and filtered to 0.02 µm prior to loading on the Calypso. The experiment consisted of a single hetero-association (‘crossover’ gradient) consisting of nine compositions of X and Y to identify the interaction affinity and stoichiometry (Figure 1, right). After each injection, the flow was stopped for 180 seconds to allow the solution to come to equilibrium.
Figure 1. CG-MALS experiment design for Experiments 1 (left) and 2 (right).
Data analysis
For each experiment, light scattering and UV absorbance data were collected throughout the entire CG-MALS run. The reaction kinetics were relatively fast, and the reaction appeared to be at equilibrium by the time the mixture entered the DAWN flow cell. This resulted in relatively flat plateaus with no evidence of slow reaction kinetics at any composition (Figure 2). The equilibrium light scattering and concentration data were fit to the appropriate models to determine the interaction affinity and stoichiometry using the CALYPSO software.
Results and Discussion
Two CG-MALS experiments were performed to determine the affinity and stoichiometry of the multivalent interaction between proteins X and Y. The initial experiment, carried out at low concentration, quantified complex formation at a high-affinity binding site and detected a possible second, lower-affinity binding site on Y for X. Several interaction models that fit the first data set reasonably well, were examined with the CALYPSO software simulation tool, and a follow-up experiment was designed to confirm and quantify the lower-affinity binding site.
Initial experiment results and analysis
In Experiment 1, light scattering and concentration data were collected for fourteen compositions of X and Y to quantify their hetero-interaction. At first glance, the light scattering data from the low-concentration CG-MALS experiment appear consistent with a 1:1 stoichiometry. The CG-MALS data reach a maximum at approximately equimolar concentrations of proteins X and Y.
Fitting the data with a 1:1 model yields a binding affinity around 10 nM (Figure 3, black dashed line). However, this fit slightly underestimates the measured data for compositions in which X is in excess of Y. For much of the hetero-association gradient, the measured light scattering intensity is up to 4% greater than what is allowed by a 1:1 stoichiometry. The difference is consistent and correlated and does not appear to be random error (Figure 3, bottom). This broader curvature is typically indicative of higher-order stoichiometries.
Including the formation of the X2Y complex in addition to the XY complex better captures the curvature in the measured light scattering data (Figure 3, solid red line). The reported χ² value for the two binding-site model was slightly improved compared to the one binding-site model (0.989 and 1.16, respectively). Furthermore, the error between the measured intensity and the fit is less than 1% for the majority of the data (Figure 3, bottom).
When considering multivalent interactions, the CALYPSO software does not require that the affinity at each binding site be equivalent; rather, the equilibrium association constant for each complex is determined independently. In this experiment, the equilibrium association constants determined by fitting to multivalent models do not support the assumption of equivalent binding sites on Y for X.
In addition to the hetero-association crossover gradient, Experiment 1 collected concentration gradients for each protein individually, in order to analyse potential self-association. Since the measured molar masses for proteins X and Y did not vary with concentration (Figure 4), we can conclude that X does not form a reversible dimer under these conditions. Thus, the X2Y stoichiometry must result from protein Y containing a second, much weaker binding site for X. Fitting the data of Experiment 1 to an association model allowing for two independent binding sites estimated Kd of the second binding site as > 10 µM, or 1000-fold weaker than the first binding site.
Follow-up experiment results and comparison to other techniques
With the Experiment 2, the interaction was measured at concentrations > 10 µM X. In addition, the majority of the data were collected under conditions of excess X to favour binding at both possible sites. As shown in Figure 5, considering only a 1:1 interaction clearly does not represent the measured light scattering signal (black dashed line). The best fit (Figure 5, red) requires the formation of XY and X2Y. Fitting the combined data set yielded dissociation constants as follows: Kd,1 = 10 nM and Kd,2 = 14 µM.
The CG-MALS results are in good agreement with the published ITC and AUC analyses for these molecules (Table 1) [3]. Like CG-MALS, both ITC and AUC are solution-based measurements and do not experience artifacts caused by surface interactions, as SPR can.
Since light scattering measures molar mass directly, CG-MALS presents additional advantages as a biophysical technique. As shown in Figure 4, the molar mass and self-interaction parameters for each binding partner can be assessed to understand the oligomeric state of the starting material. Furthermore, the measured molar mass provides a clear readout of the interaction, as compared to a secondary response, such as a fluorescent signal, ‘resonance units’ or heat of reaction. Finally, CG-MALS experiments can be performed relatively quickly to achieve binding affinity and stoichiometry. Each experiment was complete within 1-2 h (Figure 1), whereas similar quantification by AUC required 18-24 h [3].
Figure 5. Light scattering intensity and best fit analysis for experiment 2 (high concentration). Top: Measured light scattering intensity (blue circle) overlaid with best fit curves for two different binding stoichiometries. Bottom: Fit residuals corresponding to the data in the top panel.
From the best fit model, the CALYPSO software calculates the concentration of each species at each composition in the gradient.
Figure 6 shows the molar composition of each complex for Experiments 1 and 2. The thousand-fold difference in affinity at each binding site translates to as much as a ten-fold difference in the concentration of each complex, even under conditions where X is in excess of Y. This ability to determine the concentration of each species present in solution as a function of composition means that conditions can be further optimised to favour one binding partner over the other; conditions that could lead to artifacts in other analytical methods can be avoided.
Figure 6. Distribution of species for Experiments 1 (top) and 2 (bottom). The mole fractions of unbound monomer X and Y have been left off for clarity.
Conclusions
CG-MALS, automated by the Calypso, provides rapid, reliable quantification of interaction affinity and stoichiometry. Often, researchers have some knowledge of the biology or presumed interaction between two species. However, even when that is not the case, the CALYPSO software simulation tool can provide ideal conditions to begin characterising the interaction. Further refinement based on initial results can provide conditions for complete characterisation of complex multivalent interactions.
Acknowledgements
We would like to thank the organisers of the MIRG 2012 Benchmark Study for providing binase and barstar samples and including us in the study.
References
1. Yamniuk, A. P. et al. Background for the Molecular Interactions Research Group (MIRG) 2012 Benchmark Study. (2013). Presented at ABRF 2013. https://abrf.org/sites/default/files/temp/RGs/MIRG/abrf2013-mirgsession1-yamniuk.pdf
2. Yadav, S. P. et al. Molecular Interactions Research Group (MIRG) 2012 Benchmark Study Results. (2013). Presented at ABRF 2013. https://abrf.org/sites/default/files/temp/RGs/MIRG/abrf2013-mirgsession2-yadav.pdf
3. Yamniuk, A. P. et al. Development of a Model Protein Interaction Pair as a Benchmarking Tool for the Quantitative Analysis of 2-Site Protein-Protein Interactions. J. Biomol. Tech. 26, 125–141 (2015).
Digital Edition
Lab Asia 31.2 April 2024
April 2024
In This Edition Chromatography Articles - Approaches to troubleshooting an SPE method for the analysis of oligonucleotides (pt i) - High-precision liquid flow processes demand full fluidic c...
View all digital editions


Events
Apr 25 2024 Istanbul, Turkey
Apr 28 2024 Montreal, Quebec, Canada
May 05 2024 Seville, Spain
InformEx Zone at CPhl North America
May 07 2024 Pennsylvania, PA, USA
May 14 2024 Oklahoma City, OK, USA


