Bioanalytical
Improved MAb Separations with 1000 Å Superficially Porous Particles
Mar 02 2017
Author:
Stephanie A. Schuster*, Brian M. Wagner, Joseph J. DeStefano, Taylor J. Shields, William L. Miles, and Barry E. Boyes,
Stephanie A. Schuster,
on behalf of Advanced Materials Technology
The current state of the art in the analysis of monoclonal antibodies is to separate and characterise digested fragments of the antibody by reversed-phase HPLC. However, there are instances where intact analysis of the antibody is preferred. Separations of intact monoclonal antibodies using 1000 Å pore superficially porous particle columns are presented in comparison to previously reported HPLC column technologies.
The advantage of the larger pores is evident in the narrow peak shapes, the resolution of minor variants, and increased retention.
Introduction
As more effort is spent on the development and characterisation of biopharmaceuticals, the analytical techniques used to characterise these molecules must provide more meaningful information and deeper levels of detail. Pharmaceutical companies are increasingly directing their research efforts toward monoclonal antibodies (mAbs), antibody-drug conjugates (ADCs), hybridised antigen binding structures, and biosimilars. These molecules are large in size and present additional analytical challenges over classic small-molecule drug therapeutics. Figure 1 shows the crystal structure of a human IgG antibody [1]. The x-axis is about 120 Å while the y-axis is about 158 Å. In order for these large biomolecules to efficiently interact with the internal surfaces of the analytical column particles, the particles must have sufficient pore size to accommodate the dimensions shown in the figure. Since proteins are dynamic structures, and exist with significant solvent association, it is reasonably assumed that the actual structures resolved by HPLC are at least as large as the structures observed in crystal structures. When biomolecules have free access to the surface within the particle pores, the peak shapes will be narrow and excellent resolution of minor variants will be obtained. The importance of matching particle pore size to analyte size has been previously described [2, 3]. It has been suggested [4, 5] that the pore size should be on the order of 10 times the diameter of the analyte for optimal chromatographic performance.
In addition to pore structure/size consideration, the use of superficially porous particles (SPPs) to improve the separations of biomolecules is advantageous because of the small diffusion coefficients of these large analytes. HPLC is inherently a method that operates away from kinetic equilibrium, but diffusional processes directly affect band broadening. The unique particle design of SPPs features a solid silica core surrounded by a thin, porous shell. The thin shell is ideal for the slowly diffusing biomolecules as the analyte does not have to traverse the entire diameter of the particle. This reduction in diffusion path results in improved mass transfer, sharper peaks, and faster separations. For a review on superficially porous particles see Hayes, et al. [6], and for descriptions of the particles and advantages for larger protein separations, Kirkland, et al. [7]. This paper describes SPPs of a total particle size of 2.7 µm with a 0.5 µm shell containing 1000 Å pores and the improvements that can be achieved using these particles for reversed-phase HPLC separations of mAbs.
Experimental
General
Chemicals: All solvents were HPLC grade. Acetonitrile (ACN) was from EMD (Gibbstown, NJ). Trifluoroacetic acid (TFA) was from Pierce Chemicals (Rockford, IL). Difluoroacetic acid (DFA) was purchased from SynQuest Laboratories (Alachua, FL).
Equipment: A Zeiss (Jena, Germany) Auriga 60 High Resolution Focused Ion Beam & Scanning Electron Microscope was used to image the 1000 Å particles at the University of Delaware (Newark, DE). A Micromeritics Tristar II (Norcross, GA) was used to collect pore size distributions through nitrogen adsorption. A Multisizer 4e Coulter Counter (Indianapolis, IN) was used to measure particle size. A Shimadzu Nexera liquid chromatography instrument (Tokyo, Japan) was used to collect all of the chromatographic measurements.
Detection parameters: Photodiode Array (PDA) detection was used at 280 nm with a reference wavelength of 350 nm for all of the results presented.
Sample preparation: All mAbs were commercially obtained and used as received. The mAbs were diluted in water to specified sample concentration listed in the Figure captions. Mobile phase composition is listed in the Figure captions.
Techniques
Column liquid chromatography:
Columns of 1000 Å SPPs with C4 bonded phase were obtained from Advanced Materials Technology, Inc. (Wilmington, DE). The Waters BEH 300 C4 column was obtained from Waters Corporation (Milford, MA). The MAbPac RP column was obtained from Thermo Fisher Scientific (Waltham, MA).
Results and Discussion
1000 Å Particle Characterisation
SEM images of the 1000 Å SPPs are shown in Figure 2. The individual particle shown in Figure 2A has uniform and spherical shape. The typical surface area of these particles is about 20 m2/g. In Figure 2B, the particle has been cross-sectioned using a Focused Ion Beam (FIB) to reveal the 1.7 µm core and the 0.5 µm shell. The large 1000 Å pores are visible in the porous shell. The mean particle size of the 1000 Å SPPs measured by Coulter counter was found to be 2.5 µm. This is smaller than the size that was measured via SEM analysis. This difference in measured sizes may be due to the large pores which may disrupt the Coulter measurement technique. We have used the SEM size to refer to the 1000 Å particles throughout this paper, except when discussing the Coulter counter data. The particle size distribution shown in Figure 3 is narrow for the 1000 Å SPPs as has been previously reported for SPPs with smaller pore sizes [8]. For comparison, the particle size distribution of 1.7 µm 300 Å fully porous particles (FPPs) is included in Figure 3. The broad distribution of the FPPs can be quantified by the value of polydispersity which is more than three times that of the 1000 Å SPPs.
The pore size distribution as measured by nitrogen adsorption is shown in Figure 4. The mode of the distribution is at 1000 Å for the SPPs. For comparative purposes, the pore size distribution of 300 Å FPPs is also shown in Figure 4. The shift in pore size distribution is apparent, with the 1000 Å material having a significantly larger population of greater than 400 Å pores. The larger pores of the SPPs allow for large biomolecules to be able to more freely diffuse into and out of the particles to stagnant mobile phase and bulk mobile phase. Keeping in mind the suggestion that pore size should be at least ten times the diameter of the analyte in order to avoid restricted diffusion, the following calculation is presented. Ten times the value for the x-axis of the IgG in Figure 1 is about 1200 Å. The 1000 Å material has pores in this size range, and the advantages of these larger-diameter pores on reversed-phase separations of mAbs will be examined later in this paper.
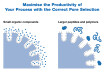
Sample Loading
Sample loading of the 1000 Å SPPs has also been investigated. Results using trastuzumab are shown in Figure 5. The plotted points are the average of duplicate measurements. Sufficient loading capacity with this mAb on the 1000 Å column was observed until the peak width increased to about five times its initial level at around 70 µg on column. Notice that for all load levels the 1000 Å SPPs have smaller peak widths than those of the 300 Å FPPs. This result may be counterintuitive coupled with the knowledge that the absolute surface area of the 300 Å FPPs is about 90 m2/g compared to about 20 m2/g for the 1000 Å SPPs. Even though the surface area of the 1000 Å SPPs is about four and half times smaller, there is not a significant difference in sample loading. This suggests that the trastuzumab sample has greater access to the surface/pores of the 1000 Å SPPs.
Improved Resolution of Minor Variants and Increased Retention of MAbs
The separation of intact (not digested or fragmented) trastuzumab using a column of 1000 Å SPPs is shown in Figure 6. Two distinct advantages are seen for the 1000 Å SPP column compared to the 300 Å FPP column: the peak width for the main trastuzumab peak is 43% smaller, and there is improved resolution of the minor variants that appear after the main peak. Another interesting observation is the increased retention of trastuzumab on the 1000 Å SPP column compared to the 300 Å FPP column despite the increased surface area for the 300 Å FPP column. Analysis of small molecule retention comparing these two columns demonstrated greater retention with the 300 Å FPP column [9], consistent with its greater surface area measurements. These data coupled with the load data shown in Figure 5 indicates that there is greater access for large molecules to enable uninhibited surface interaction with the 1000 Å column, compared to the 300 Å column. All of the analytical data suggests that the pore size and distribution play a significant role in the separation processes.
The 1000 Å SPP column was also compared to another large pore column. The separation of trastuzumab shown in Figure 7 compares the 1000 Å SPP column to a 1500 Å fully porous polymer particle column. This separation also demonstrates the increased retention and improved resolution of minor variants for the 1000 Å SPP column. In this case, the peak width of the major peak is 24% smaller on the 1000 Å SPP column. The peak may be sharper due to the combination of smaller particle size and thin shell of the 1000 Å SPP column (2.7 µm with 0.5 µm shell) compared to the 4 µm particle size of the 1500 Å fully porous polymer particles. Enhanced resolution of the minor variants is again observed with the 1000 Å SPP column.
Conclusions
The large 1000 Å pore size of the SPPs used for RP-HPLC described herein enables full access to the surface for larger molecules such as intact mAbs. This improved access to the surface results in enhanced resolution of minor mAb variants and narrower peak widths and can lead to increased retention. As pharmaceutical companies develop more biotherapeutics, the need to completely characterise those molecules will continue to grow. The ability to separate intact monoclonal antibodies and their variants, together with mass spectrometric characterisation techniques should greatly enhance biotherapeutic advancements going forward.
Acknowledgements
The authors would like to thank Mark R. Schure and Richard A. Henry for valuable suggestions and feedback and Conner McHale for chromatographic measurements.
This work was supported in part by National Institute of General Medical Sciences, [GM116224 to BEB]. The content is solely the responsibility of the authors and does not necessarily represent the official views of the National Institute of Health.
References
1. Image from the RCSB PDB (HYPERLINK “http://www.rcsb.org” www.rcsb.org) of PDB ID 1HZH E.O. Saphire, P.W. Parren, R. Pantophlet, M.B. Zwick, G.M. Morris, P.M. Rudd, R.A. Dwek, R.L. Stanfield, D.R. Burton, I.A. Wilson (2001) Crystal structure of a neutralizing human IGG against HIV-1: a template for vaccine design Science 293: 1155-1159.
2. B.M. Wagner, S.A. Schuster, B.E. Boyes, J.J. Kirkland, J. Chromatogr. A 1264 (2012) 22.
3. S.A. Schuster, B.M. Wagner, B.E. Boyes, J.J. Kirkland, J. Chromatogr. A 1315 (2013) 118.
4. S. Fekete, J.-L. Veuthey, D. Guillarme, J. Pharm. Biomed. Anal. 69 (2012) 9.
5. R.A. Henry, S.A. Schuster, LCGC North America submitted.
6. R. Hayes, A. Ahmed, T. Edge, H. Zhang, J. Chromatogr. A 1357 (2014) 36.
7. J.J. Kirkland, S.A. Schuster, W.L. Johnson, B.E. Boyes, J. Pharm. Anal. 3 (2013) 303.
8. J.J. DeStefano, T.J. Langlois, J.J. Kirkland, J. Chromatogr. Sci. 46 (2008) 254.
9. B.M. Wagner, S.A. Schuster, B.E. Boyes, T.J. Shields, W.L. Miles, M.J. Haynes, R.E. Moran, J.J. Kirkland, M.R. Schure, J. Chromatogr. A (2017) accepted.
10. J. Wypych, M. Li, A. Guo, Z. Zhang, T. Martinez, M.J. Allen, S. Fodor, D.N. Kelner, G.C. Flynn, Y.D. Liu, J. Biol. Chem. 283 (2008) 16194.
11. Y. Zhang, R. Bailey, N. Nightlinger, A. Gillespie, A. Balland, R. Rogers, J. Chromatogr. B 997 (2015) 30.
Digital Edition
Chromatography Today - Buyers' Guide 2022
October 2023
In This Edition Modern & Practical Applications - Accelerating ADC Development with Mass Spectrometry - Implementing High-Resolution Ion Mobility into Peptide Mapping Workflows Chromatogr...
View all digital editions


Events
Apr 28 2024 Montreal, Quebec, Canada
May 05 2024 Seville, Spain
May 15 2024 Birmingham, UK
May 19 2024 Brno, Czech Republic
May 21 2024 Lagos, Nigeria


