Good morning or good evening, everyone, depending on where you are in the world. My name is Adyary Fallarero, and I am a senior manager in product management for imaging technologies at Thermo Fisher Scientific. I'm located in Finland. Hello, everyone. My name is Chris Langsdorf, and I'm a global product manager in protein and cell analysis, also at Thermo Fisher Scientific, and I'm in the United States.
We are both super grateful to have you all attending our talk, and today we will be sharing with you all of the new tools that our company has recently developed to advance multiplex imaging for spatial proteomics research. We hope you'll benefit and gain new knowledge on spatial biology. Feel free to get in contact with us and our teams afterwards if you need any more information or if you have questions.
So let's get started.
We'll jump right in and look at new tools to tackle multiplex imaging challenges in spatial proteomics. Our agenda today includes looking briefly at the revolution in spatial biology, examining some challenges that arise when we start to look at multiplex proteomic imaging, and discussing how we've addressed these challenges using both sample labeling and imaging and analysis techniques.
Spatial biology provides us better insights into our samples primarily because we're able to analyze not just single cells, but also their context in a larger environment. We can use antibody-based detection to tell us what cell types are present and the state of those cells, such as their metabolic or activation state, and what functions they're carrying out. Because our samples are generally fixed, we can get an idea of their identity in both time and space. By studying multiple cell types simultaneously, we can understand the interaction of those cells and how they form larger and more complex neighborhoods or networks.
We can begin to understand both the tissue microenvironment and the architecture of our sample in its native state. Let's look at an example of how this works. We can image an entire tissue section and zoom in on one section of the sample to understand the spatial context. By displaying multiple different colors, we can see the location of different cell types as they exist in their native environment. Then we can use our analysis tools to mask and identify the different cell types that we've labeled with antibody-based detection. We can go a step further with our analysis and ask questions like, "What is the nearest neighbor to each of these cell types?" and begin to understand the network and architecture of our sample in much greater detail.
Several challenges arise when we switch to this type of spatial workflow. Generally, with microscopy, we use primary antibodies followed by fluorescently labeled secondaries. When we move from three or four antibody-based targets up to eight, secondary antibodies are no longer useful. We need to pivot and begin using primary antibody conjugates. As we see here, the primary antibody labeling workflow is very fast. We can make a cocktail of all of these antibodies and label our sample in about an hour. There are some drawbacks, though, such as a generally limited catalog menu available of these conjugates. Unlike with secondary-based detection of three or four targets, where we always choose the three or four brightest dyes available, here we need to choose dyes based on their spectral properties and not necessarily on their brightness.
Fortunately, there's a solution to this challenge provided by the Allura Spatial Amplification Reagents. Here we use a three-step workflow. First, we label our sample with a primary antibody, followed by a wash and then labeling with a secondary antibody HRP conjugate. After this, we add our Allura spatial amplification reagents, which are covalently attached to our sample in the location of our antibody binding. After this step, all of the antibodies are stripped off our sample, leaving just a very bright fluorescent labeling in the location of each antigen that was originally present. As we can see on the left, after one round of labeling, we can see the location of one antigen of interest. After repeating, we can see a second, third, fourth, and up to eight plex with great sensitivity and very bright signal. This gives us a lot of flexibility in how we choose and use our antibodies. Because amplification is provided, we can use substantially less antibody, and we're not required to covalently attach a dye to the antibody. The drawback here is it's a longer workflow, so we have to go through multiple labeling cycles.
The Allura Spatial Amplification Reagents are compatible with primary antibody conjugates. You see two examples here where the primary antibody conjugates are labeled with a few of our brightest dyes available, such as Alexa Fluor 647 and 594, which give us great signal to background for these primary conjugates. With either a less bright dye or a lower expressed antigen, we switch to the Allura spatial amplification reagent to give us that signal to background that we need. As far as the availability of primary antibody conjugates, there are a few ways besides just acquiring these from a catalog. These are quite available to produce as a DIY method. There are kits available that make it very easy to label your antibody with your dye of choice that's compatible with the system, either by assembling a kit using your own purification system, or we have a technology called Ready Label that does two things: it both purifies your antibody and then labels it with one of these eight compatible dyes and gives you a purified conjugate. Or if you ship your antibody to us, our experts will conjugate it and return it back to you. There is a lot of flexibility and convenience available with these options. However, they can be a bit more expensive than just acquiring a conjugated antibody from a catalog.
Thanks so much to Chris for sharing with us the labeling tools that we've been developing to advance spatial proteomics research. Now we're going to switch gears a bit and focus on instrumentation, specifically fluorescent microscopy instrumentation. You all are very aware that fluorescent microscopy can be and has been extensively used to investigate how single cells are organized into a tissue microenvironment, and none of the currently available technologies are really perfect. They all have benefits and drawbacks. What we've tried to do from our perspective is tackle some of the drawbacks of the currently available instrumentations and progress in that manner the type of research that spatial biology scientists can perform. I start maybe with a bit of an overview of what we currently have available and then how we have addressed the current limitations of the existing technologies.
I think you are all very well aware that a great body of research that has been done around spatial proteomics has been done using cyclic labeling and imaging. Imaging that is done in this approach is really pretty conventional. There are between two to four fluorescent channels that are used on those instruments. The benefit of this approach is that because it is performed in a cyclic manner, it allows for a high number of protein targets to be interrogated. The drawback, on the other hand, is that because it's a cyclic process, it tends to be of a lower throughput, and because it is constant illumination of the sample and they go through certain rounds of stripping, that can damage the integrity of the tissue.
The approach that we have taken and that we have tried to address the current limitations is really spectral imaging. Spectral imaging allows for the capture of simultaneous fluorophores within one single round. Instead of only doing the conventional two to four channels, maybe even five fluorescent channels in one single go, the aim of spectral imaging is to capture between seven to ten, even sometimes more, fluorophores in a single round. There is an advantage from doing this: tissue gets better preserved. However, there is also a drawback, and the drawback comes from the fact that when there are so many fluorophores that get acquired in a single imaging round, there is signal bleed-through that needs to be eliminated.
If we try to understand a bit more why this drawback exists in spectral emissions and where it comes from, we can go to the root cause of that problem. The root cause is that the majority of the fluorophores used for spatial imaging have a very broad emission spectrum. If we are imaging ECAD in a 514 channel, the emission spectra of the 514 channel will also appear and show up in both neighboring channels, such as 488. To resolve that signal and remove that bleed-through, we can apply a mathematical process called unmixing. Unmixing is a relatively straightforward process by which we establish the relative contribution that each fluorophore used in that specific protocol has to every pixel of the image. This is done by acquiring spectral signatures from the unstained tissues to account for the typical autofluorescence seen in biological samples, and then from the individually stained fluorophores on the same tissue where the assay is being performed.
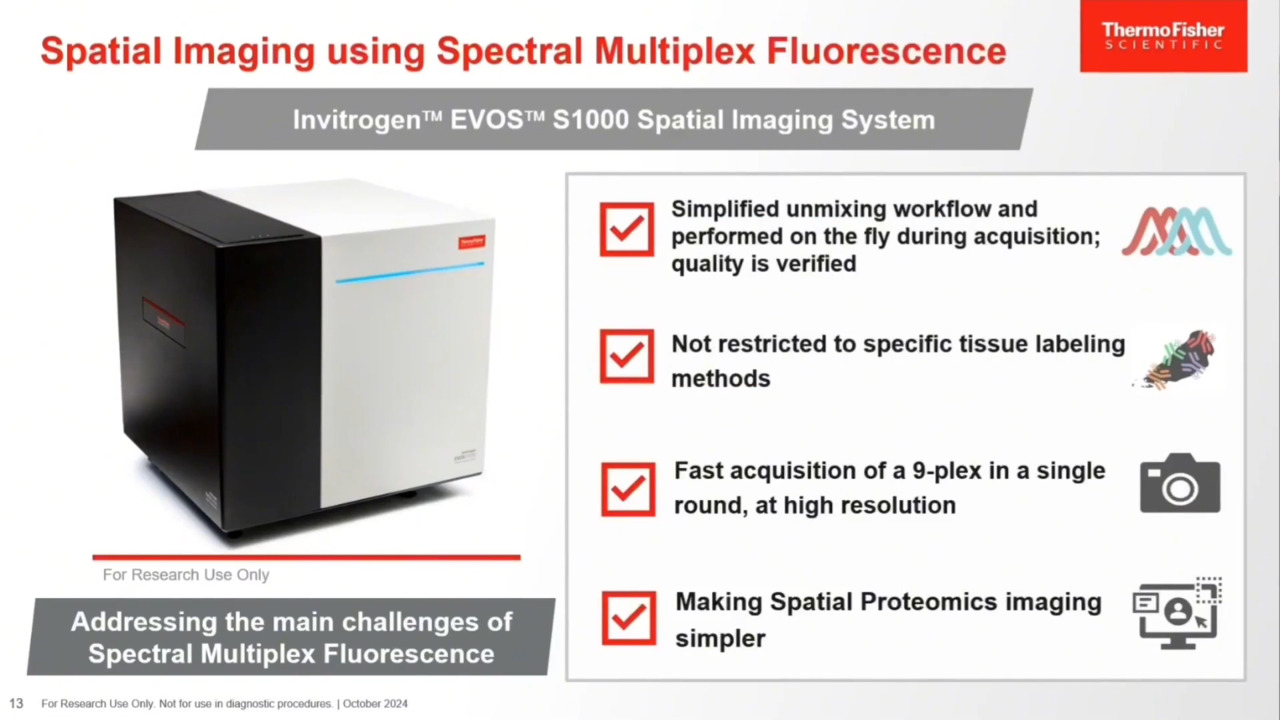
Using spectral emission, protein targets can be easily resolved and discriminated even if the fluorescent spectral signals overlap. As you can see in the bottom images shown here, ECAD in the 514 channel can be very clearly discriminated from the CD163 and the PD1 signal that appears in the two neighboring channels. This main drawback associated with spectral technologies is something that we truly wanted to address with our new instrument. Our new instrument is launching now in the fall and is called Invitrogen EVOS S1000 Spatial Imaging System. We have paid a lot of attention to simplifying the unmixing workflow, keeping it very straightforward. It also performs in a way that it is part of the acquisition, done on the fly while the images are being acquired. We have also tried to verify the quality of the unmixing. We provide substantive data as part of a quality report that allows the user to understand the quality of the unmixing that has been performed.
We have gone beyond improving the unmixing workflows by addressing other challenges encountered with currently existing spectral imagers. One of them is the fact that they are often restricted to very specific labeling methods. We have tried to expand the number of dyes that can be utilized and the type of technologies that can be used with EVOS S1000. We have also tried to make it fast so you don't have to spend hours to acquire a 9-plex. You can do it in a single round. EVOS S1000 allows users to acquire up to 8 protein targets and DAPI, making for a 9-plex, while keeping a high resolution of 325 nanometers per pixel at 20x. Last but not least, it's about making spatial proteomics and spatial biology accessible to a broader audience so that many more researchers can utilize spatial biology and study biological processes using these tools. We are not making it simple, but we are trying to make it simpler.
Let's go through the challenges that are presented in currently existing spectral imagers. The first one is that unmixing tends to be limited to very specific dyes that are often proprietary. We have tried to address that issue. When you generate a protocol with EVOS S1000, you will be presented with a repertoire of dyes, roughly around 30 dyes, that includes Alexa Fluor, Alexa Fluor Plus, and special amplification reagents such as Aluora Spatial Amplification Reagents and dyes. You can select the dyes, and the software will show you the overlap that exists on the emission spectra of those dyes that have been selected. We then set up a channel configuration automatically that will acquire the primary channels, shown in blue, as well as the support channels needed to eliminate bleed-through from the proximity of the spectral signals. This is done completely automatically without any user input. The user can also define the product targets on the assay.
Another challenge we have tried to address is the complexity of performing unmixing for anything higher than a 7-plex. Our solution is using the same unmixing workflow regardless of the plex. If you go to a 7-plex or all the way to a 9-plex, the workflow remains the same. First, an unmixing matrix needs to be generated by extracting spectral data from images. Users will need to first acquire an image of their unstained tissue slide and then individual single-color calibrator slides. Once that happens, you can utilize that protocol and start setting up a 9-plex assay. The system will start to acquire images in every single field of view, and at the same time, unmixing will be triggered as part of the image acquisition workflow. You can acquire a 1-square-centimeter 9-plex image that is fully unmixed and stitched in an OMET file format within roughly one hour using a magnification of 20x.
The unmixing workflow eliminates the need for any post-processing. Users should not only subjectively assess the quality of their unmixing. We have addressed this issue by generating an unmixing quality metrics report that contains both raw images versus the unmixed image for qualitative assessment and quantitative parameters that allow users to estimate the quality of the unmixing. We provide clear cutoff values and troubleshooting tips to improve the unmixing process if needed.
We believe that every system and method for microscopy needs to be simple and intuitive, even for users new to the space. We have a proprietary feature called Periscope mode that allows users to turn on any channel and explore their tissue, making it practical and simple for new users to interact with. We aim to provide sophisticated simplicity that allows anyone to quickly gain confidence and easily set up, acquire, and visualize 9-plex images.
The EVOS S1000 can be utilized with multiple labeling strategies. Examples of results obtained using Allura special amplification reagents show very bright signals that can easily discriminate between targets with low expression levels. The EVOS S1000 can also be used with primary conjugates, allowing for a quick labeling step completed within about two hours at 20x, including unmixing and processing of the data to generate an OME TIFF file. If primary conjugates are not available, another option is to directly conjugate primary antibodies using Ready Label kits. This approach is compatible with the EVOS S1000 and provides flexibility in labeling strategies.
The EVOS S1000 Spatial Imaging System is a novel alternative in the spatial imaging space. We aim to provide a choice of achieving high multiplex ability in a single emission step without the complexity of a laborious unmixing workflow. We have made it simple and reliable, providing quality metrics and flexibility in using spatial amplification reagents or validated primary antibody conjugates. We are happy to answer any questions and be a partner in your spatial biology journey. Thank you so much for joining the talk.