Air Monitoring
Continuous Fine Particulate Emission Monitoring System for Low Particle Concentrations
Apr 02 2024
Author: Alexander Schladitz on behalf of SICK Engineering GmbH
Free to read
Articles are free to download. Unlock the article to be shown more content, graphs and images.
Summary
A measuring device that is currently being developed for continuous fine dust particle classification is presented. The device presented is the world’s first continuously measuring fine dust measuring device for emissions applications. It can holistically solve problems in the area of emissions through direct measurement of a dust size distribution with the lowest dust emission measurements of 1-2 mg/m³, as well as in process monitoring through the measurement of fine dust fractions PM2.5 and PM10. The technology has already proven its functionality in more than two test facilities in an industrial environment by providing measurement data over a representative period. Global testing of 10 industrial demonstrators for various fields of application (biomass combustion, cement factory, urea granulation, battery recycling, etc.) is currently underway. The data obtained by the industrial demonstrators should provide customer benefits on a broader basis and serve to reduce reservations about this technological innovation in the standardization committees.
1. Challenge: Emission
Using highly efficient filter technologies, e.g., electrostatic precipitators in lignite-fired power plants and fabric filters in waste incineration plants, the overall dust mass concentration in industrial plants continues to decline. At the same time, international, European, and national interest groups, e.g., the Federal Republic of Germany’s National Air Pollution Control Program [1], insist on the enforcement of stricter emission limits. It is therefore foreseeable that the emission limits that plant operators must comply with will continue to fall. What makes matters worse is that margins will fall due to the energy transition and thus increasing cost pressure on system operators. According to the current state of technology, dust measuring devices for emission applications are not yet able to directly measure a dust mass concentration value. Instead, the attenuation of light in the chimney (transmissometer, opacimeter) is determined by comparing the intensity of the transmitted and received light beam.
Both methods only output a relative signal (usually transmitted in mA), which corresponds to the amount of dust in the chimney. In practice, it is therefore necessary to calibrate these so-called automatic measuring devices (AMS) against the gravimetric standard reference method (SRM) according to [2], [3] on the respective system (see Figure 1). However, if dust concentration measurements in the clean gas behind a flue gas dedusting system are in the range of 1-2 mg/m³, this can be a difficult, lengthy and therefore expensive process for the system operator, since the measurements are sometimes repeated several times due to implausible measured values in both the AMS and the SRM.
In addition to the total dust mass concentration, there are also specific requests to continuously quantify the particle size distribution or dust fractions PM10, PM2.5 and PM1 (the index shows the largest measured particle diameter in micrometers) to further optimize the production and combustion processes or exhaust gas cleaning. True to the motto “to reduce fine dust, you have to quantify the sources of fine dust,” direct measurement of the fine dust fractions at the source is a key to reducing large-scale pollution. To do this, continuous monitoring of the PM fractions makes a valuable contribution to human health and thus provides individual added value. It is due to technical progress and social interest that limit values for the above-mentioned fractions will also become established in emissions measurement, if there is a technology that can determine them easily and reliably.
When the type of fuel is changed, the filter breaks or the system is operated, the particle size distribution usually changes. However, due to the calibration described above, the automatic measuring system with the calibration curve is linked to a specific type of fuel, operating style of the system and thus particle size distribution at the time of calibration.
As an example: if the average particle size changes from 3 µm to 15 µm in the event of a filter break and the calibration line was determined at an average particle size of 3 µm, the true dust mass is underestimated because the automatic measuring system cannot record this increase in particle size (see red line in Figure 2).
If one or more of the above-mentioned parameters changes between the calibration intervals, which usually take place once a year, incorrect measurement values will inevitably be determined. For some system operators, this leads to problems with approval authorities if, in $reality, higher dust measurement values are achieved when parameter changes are made than indicated by the AMS. Another disadvantage can arise for system operators if the separation efficiency of the electrostatic precipitator must be increased to very high values through the direct control of an AMS. However, this will be examined in more detail in the next chapter.
2. Challenge: Process monitoring and other applications
In some plants with electrostatic precipitators for dust separation from the flue gas, the efficiency / degree of separation of the filter is controlled directly by the AMS located on the clean gas side. If higher dust measurement values are recorded that they are in reality -due to the calibration dependence- the filter efficiency of the electrostatic precipitator must inevitably be increased to prevent exceeding possible limit values. This is illustrated in Figure 3. Increasing filter efficiency results in significantly higher operating costs, which should be avoided, especially from the perspective of energy efficiency.
3. Proposed solution and scientific and technical progress
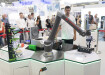
The SICK Engineering GmbH has developed a so-called “Fine Dust Emission Monitoring System” (FDEMS), a continuously measuring fine dust particle analyzer that meets the above-mentioned measurement requirements. This is an extractive system with precise suction volume flow measurement. This is particularly necessary in emissions measurement, as isokinetic sampling is required in accordance with the applicable guidelines. After sampling has been carried out by the gas sampling unit (Figure 4), the measurement gas with the particles carried is passed through a measuring chamber within the sensor unit, in which particles are optically detected.
In the measuring chamber, the angle- and wavelength-dependent particle scattering is measured using a few highly sensitive detectors. A signal analysis on the main processor transforms the measured detector values into a physical measurement signal using a factory calibration. A mathematical model continuously calculates (~1 min) the particle volume versus the particle size (particle volume size distribution curve). Any particle mass concentrations are calculated from the particle volume size distribution curve by partial integration in the range from 0.1 to 30 µm particle diameter assuming a particle density (specific particle weight). With this technique it is possible to directly record changes in the particle distribution and thus the total accumulation concentration without the need for recalibration (see Section 1). In addition, the measurement results are independent of the dust type being measured and its chemical composition and shape.
Figure 4: FDEMS system components
The sample gas sucked in is transported back into the chimney via a gas return hose (Figure 4). A purge air unit provides filtered and heated purge air and ensures reducing contamination of optical surfaces with dust and prevents condensation of the hot process gas (max. 220°C) in the sampling line.
In September 2018, a comparative measurement of the functional model took place at the emissions simulation facility of the Hessian State Office for Environment and Geology in Kassel with the following objectives:
- quantitative comparison for the measured variables total dust, PM10 and PM2.5 compared to the gravimetric standard reference method.
- investigation of the influence of different particle sizes on the measurement result.
- verification of the measurement method in the typical concentration range of systems between 0.5 and 10 mg/m³.
To investigate the influence of different particle sizes on the measurement results, two different dusts made of calcium carbonate with an average particle size of 3 µm (eskal300) and 5 µm (eskal500) were selected.
Figure 5 shows the correlation of the measured variable PM10 compared to the standard reference method [4], also with a slight decrease of 26%.
In April 2020, additional comparative measurements of the FDEMS versus a transmissometer were carried out in the clean gas at a lignite-fired power plant. The blue curve in Figure 6 shows the course of the measurement signal for total dust from the transmissometer under operating conditions compared to the measurement signal for total dust from the FDEMS (red curve). The curves show underground jumps in the range from ~0 mg/m³ to 10 mg/m³. In addition to the good correlation of both curves, it can be clearly seen that the blue curve does not fall to ~0 mg/m³ when the system is operated at a reduced rate, but rather shows the lower end of the calibrated measuring range (4mA), which corresponds to a dust concentration measurement value of 0.95 mg/m³. The PM10 reading, which is shown by the yellow curve, shows that during this period almost all particles present in the clean gas are smaller than or equal to 10 µm in diameter and almost 50% of the particles are smaller or equal to 2.5 µm in diameter (PM2.5 - purple curve).
With the data presented from the test device, we have already been able to show that the challenges addressed in chapter 1 and 2 apply in practice and that we are able to solve them with the measuring device. The technology now -that means in January 2024- has already proven its functionality in more than two test facilities at industrial environment by providing measurement data over a representative period. The solution to similar problems in further application fields is currently being evaluated. Technology contributes to environmental protection and makes it possible to control emissions as a source of pollution.
References
[1] National Air Pollution Control Program of the Federal Republic of Germany, publisher: Federal Ministry for the Environment, Nature Conservation and Nuclear Safety (BMU) - Working Group IG I 2, date of publication: May 22, 2019, URL: https://www.umweltbundesamt.de/nlrp2019, accessed on March 27, 2022
[2] EN13284-2:2015: Emissions from stationary sources - Determination of dust mass concentration at low dust concentrations - Part 2: Automatic measuring devices.
[3] Gravimetric reference measuring system according to DIN EN 13284-1, see www.graviblue.com
[4] Association of German Engineers (VDI 2066-Sheet 10): Measurement of emissions of PM10 and PM2.5 from sources using the impaction method from October 2004.
Free to read
Articles are free to download. Please login to read this article or create an account.
Digital Edition
Lab Asia 31.2 April 2024
April 2024
In This Edition Chromatography Articles - Approaches to troubleshooting an SPE method for the analysis of oligonucleotides (pt i) - High-precision liquid flow processes demand full fluidic c...
View all digital editions


.jpg)
Events
May 05 2024 Seville, Spain
InformEx Zone at CPhl North America
May 07 2024 Pennsylvania, PA, USA
May 14 2024 Oklahoma City, OK, USA
May 15 2024 Birmingham, UK
May 21 2024 Lagos, Nigeria


